Figures & data
Figure 1 Identification of DEGs between SLE and healthy controls. (A) Volcano plot illustrating 85 DEGs identified in GSE49454. (B) Volcano plot illustrating 113 DEGs identified in GSE65391. (C) Venn map showing 65 overlapping DEGs between the two datasets.
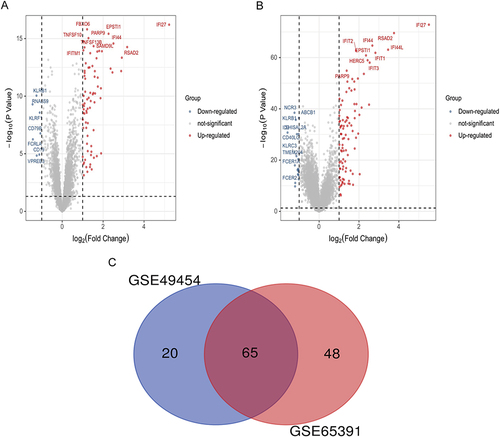
Figure 2 Functional enrichment based on DEGs. GO analysis for DEGs showing significant terms through (A) A bar plot and specific genes associated with these terms through (B) A gene-concept network. KEGG analysis for DEGs indicates enriched pathways via (C) A bubble plot and specific genes associated with these pathways through (D) A gene-concept network.
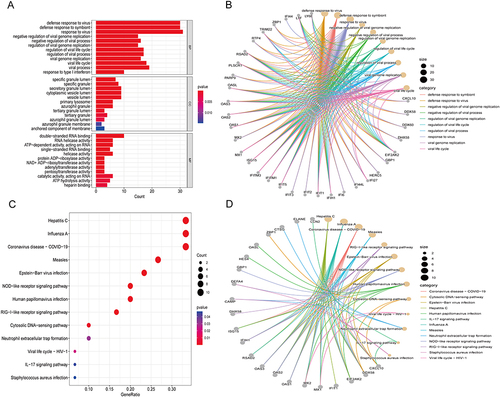
Figure 3 Identification of IFI44 and RSAD2 by cross-linking genes from 11 ranking methods in the PPI network. (A) The PPI network acquired from the STRING database. (B) Upset plot representing the intersection between 11 ranking methods.
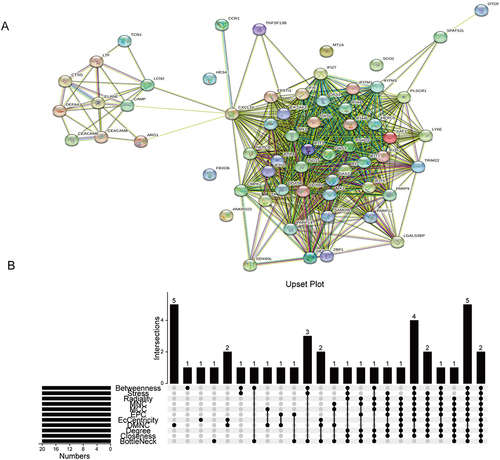
Figure 4 The relationship between diagnostic biomarkers and immune cell infiltration in SLE and healthy controls. Box plot of 22 types of immune cell infiltration in SLE and healthy controls in GSE49454 (A) and GSE65391 (B). The size of the dots represents the strength of the correlation between IFI44 expression and infiltrating immune cells in GSE49454 (C) and GSE65391 (D), with the color of the dots representing the corresponding P-values. Statistical significance was defined as P< 0.05.
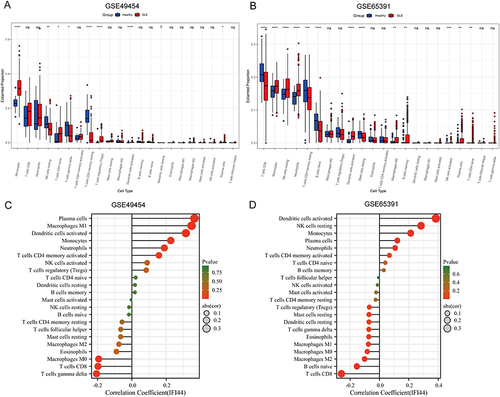
Figure 5 Relative expression in SLE patients and healthy controls. (A) The expression of IFI44 was significantly increased in SLE patients compared to healthy controls, and it was significantly upregulated in male patients (*P<0.05, **P<0.01, ***P <0.001). (B) The diagnostic value of IFI44 in SLE.
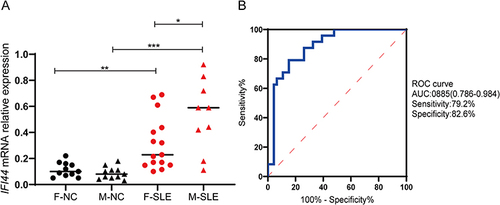
Table 1 Correlation Between Relative Expression of IFI44 and Clinical Indicators in SLE Patients
Figure 6 Correlation analysis of IFI44 expression level and clinical indicators in SLE patients. IFI44L had negative correlation with IgA, RBC, HCT, HGB (A–D), and had positive correlation with ESR and UPRO (E and F) in SLE patients.
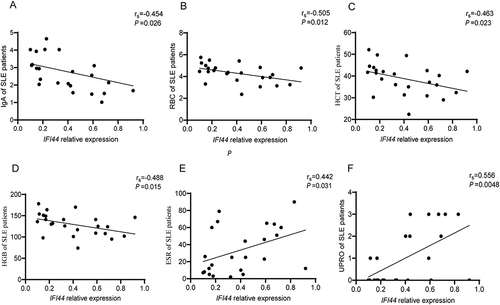
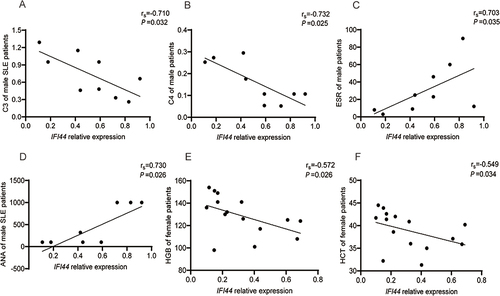
Figure 7 Correlation analysis of IFI44 expression level and clinical indicators in male (A–D) and in female (E and F) SLE patients.