Figures & data
Table 1 Outline of Experimental Group Allocation for the Mouse Hindpaw Experiments. All Treatments Were Administered Prior to Injection of 50 µL of 1% w/v Carrageenan to Induce Inflammation
Table 2 Outline of Experimental Group Allocation for the Rat TMJ Inflammatory Experiments. All Treatments Were Administered Prior to Injection of 50 µL of 1% w/v Carrageenan to Induce Inflammation
Figure 1 Paw circumference measurement and physical signs of edema 4 hours after carrageenan injection in the mouse and rat models. (A) The black line surrounding the mouse paw demonstrates position of edema measurement (360° around the paw) from the 1st metatarsophalangeal joint to 5th metatarsophalangeal for measurement of paw circumference. (B) A Wistar rat with a shaved right pre-auricular region (arrow) prior to carrageenan injection and (C) with observable edema in the pre-auricular and peri-orbital regions (chevrons) 4 hours after carrageenan injection.
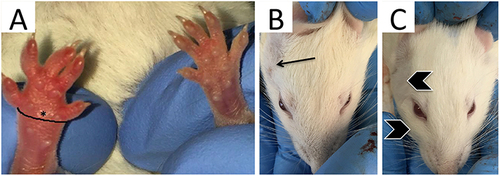
Figure 2 Circumference measurements at 48 hours post-induction of inflammation. Data for each paw was normalized using baseline measurements taken at 0 hours (prior to any injections) (n=6 for controls, n=8 for all other groups). Displayed as mean ± SD for each group. ***p<0.001, ****p≤0.0001.
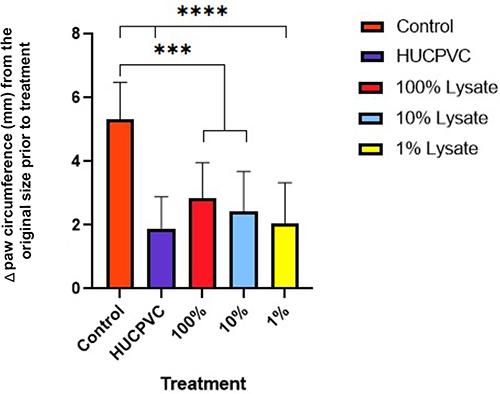
Figure 3 MPO activity in the inflamed paw. MPO levels were measured 48 hours post-induction of inflammation and normalized using total protein (n=6 for control, n=8 for all other groups). ELISA sensitivity = 250–16,000 pg/mL. **p<0.01. ***p<0.001. Data is displayed as mean ± SD. MPO data derived from same mouse hind-paw recorded in edema measurements.
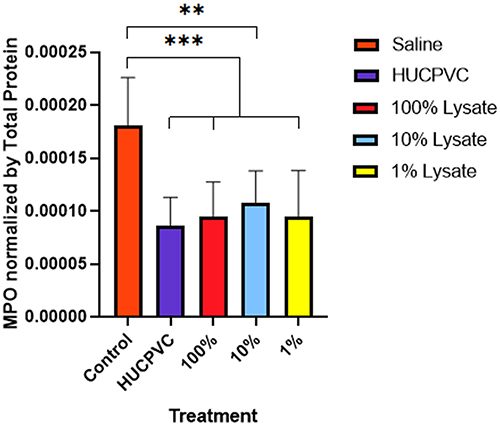
Figure 4 Logarithmic transformation of TNF-alpha activity normalized using total protein in the inflamed paw: . TNF-alpha levels were measured 48 hours post-induction of inflammation and normalized using total protein (n=6 for control, n=8 for all other groups). ELISA sensitivity = 10.9 to 700 pg/mL. *p<0.05. **p<0.01. ***p<0.001. Data is displayed as mean ± SD. TNF-alpha data derived from same mouse hind-paw recorded in edema measurements.
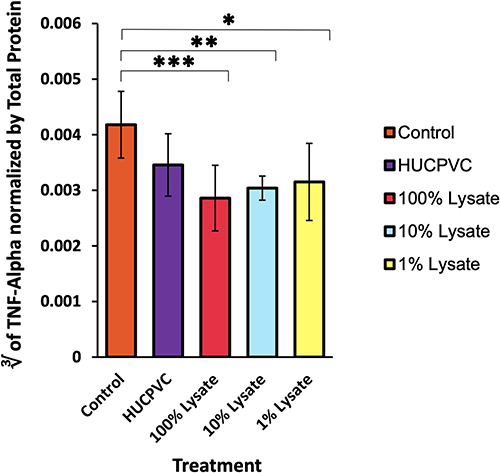
Figure 5 Boxplot representing logarithmic transformation: y’ = log(y) of cell counts (8–12 µm in diameter) isolated from lavages of the TMJs at the indicated timepoints. (n=8 for each sample).
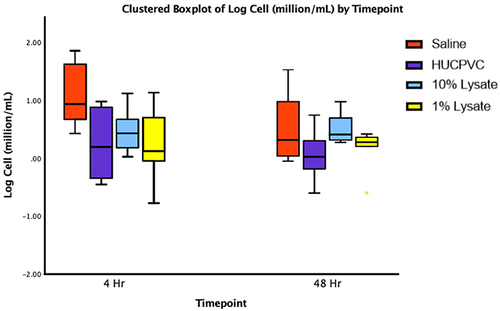
Figure 6 Photomicrographs of H&E stains of the peri-articular tissues of the control specimens compared to the 1% cell lysate and the HUCPVC-treated specimens at the 4-hour and 48-hour timepoints. White arrows indicate the anterior (left arrows in photomicrographs) discal attachments and the retrodiscal tissues (right arrows in photomicrographs) where increases in cell density in the synovial lining were observed in the controls and not the treated specimens. These regions are shown in higher magnification in and . Scale bar = 200 µm.
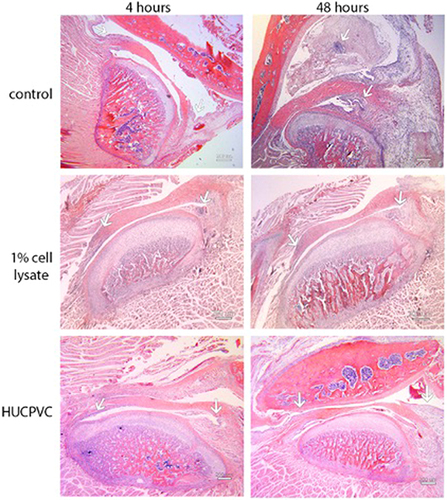
Figure 7 Photomicrographs of H&E stains of the anterior discal attachments and synovial lining of the control specimens compared to the 1% cell lysate and the HUCPVC-treated specimens at the 4-hour and 48-hour timepoints. The white arrow in the top left photomicrograph demonstrates a region of capillaries that were dispersed throughout the underlying loose connective tissue below the synovial lining in the 4-hour control. The 48-hour control specimen demonstrates increased cell density (white arrow) in the synovial lining and the formation of villous-like projections secondary to infolding of the synovial lining that was not observed in the lysate and HUCPVC-treated specimens. Scale bar = 200 µm for 1% cell lysate and HUCPVC-treated groups, 100 µm for control.
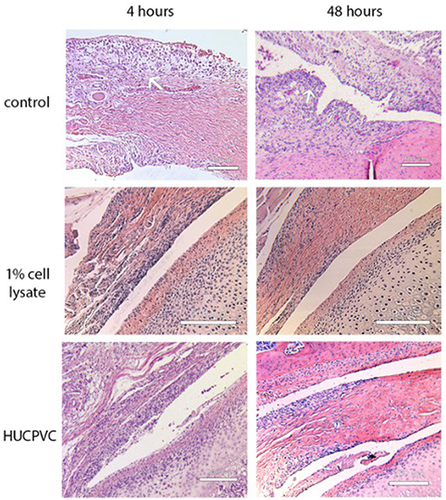
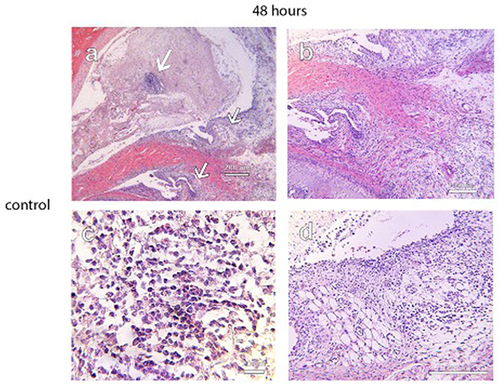
Figure 8 Photographs of H&E stains of a control specimen at 48 hours demonstrating focal regions of dense lymphocytic cellular infiltrate in the superior joint space. (a, top arrow and c), the formation of villous-like projections within the synovial lining and the proliferation of loose fibrous connective tissue in the retrodiscal attachment (a, middle arrow and b), and increased cellular density along the synovial lining (a, inferior arrow 7 d). These signs of inflammation were not observed in specimens from the treatment groups. Scale bar = 200 µm for (a), 100 µm for (b) and (d), and 20 µm for (c).