Figures & data
Figure 1 Cumulative survival rate of ISOF, DEX and ISOF combined with DEX on LPS-induced sepsis in mice. (A) Effect of different concentrations of ISOF on the cumulative survival rate. (B) Effect of different concentrations of DEX on the cumulative survival rate. (C) Effect of combined ISOF and DEX single ineffective dose on the cumulative survival rate. (D) Effect of combined ISOF, DEX single effective dose on cumulative survival rate. (E) Cox regression analysis of the effect of ISOF combined with DEX on the cumulative survival rate of mice with LPS-induced sepsis. Compared with LPS groups, #P<0.05; compared with DEX group, *P<0.05; compared with ISOF group, &P<0.05 (n=12). Kaplan-Meier test and Log rank test were used to compare survival curves. Cox proportional hazards regression model was used to analyze the effect of the combined use of ISOF and DEX on survival curves.
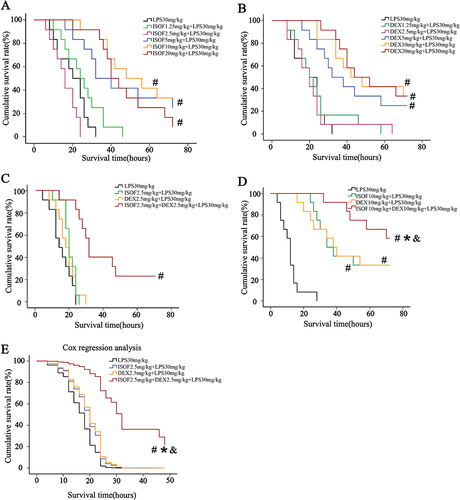
Table 1 Bliss Independence Model to Calculate Drug Interactions
Figure 2 Effects of ISOF and DEX on histopathological changes of lung tissue in ALI mice (A) Histopathological changes (HE staining, ×100). (B) Lung injury score. (C) wet/dry weight ratio. LPS 5 mg/kg, ISOF 10 mg/kg, DEX 5 mg/kg. Compared with control group, #P<0.05, compared with LPS group *P<0.05 (n=5-8). Compared by one-way analysis of variance or Kruskal–Wallis or one-way analysis of variance on ranks followed by Student–Newman–Keuls test.
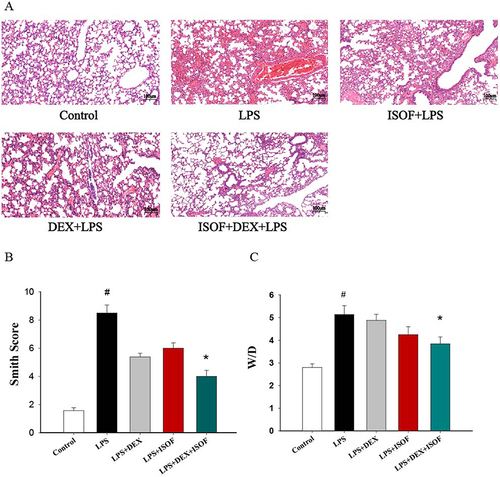
Figure 3 Effects of ISOF and DEX on MDA (A), MPO (B) and SOD (C) levels in lung tissue homogenate of ALI mice. LPS 5 mg/kg; ISOF 10 mg/kg; DEX 5 mg/kg. Compared with control group, ###P<0.001; compared with LPS group,*P<0.05, **P<0.01, ***P<0.001; Compared with LPS+DEX group, andP<0.05; compared with LPS+ISOF group, $$P<0.01 (n=4). Compared by one-way analysis of variance or Kruskal–Wallis or one-way analysis of variance on ranks followed by Student–Newman–Keuls test.
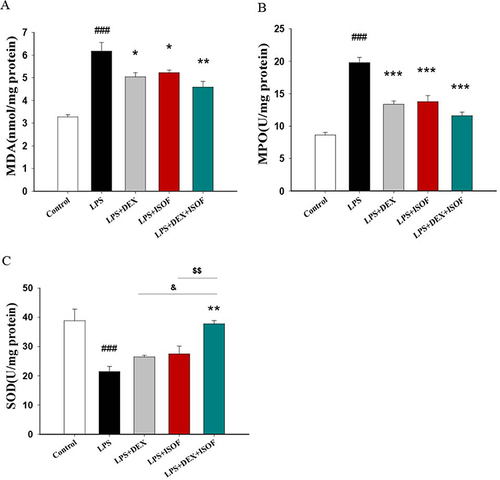
Figure 4 Effects of ISOF and DEX on IL-6 and IL-8 levels in lung tissue of ALI mice. (A) IL-6 level determined by ELISA. (B) IL-8 level determined by ELISA. LPS 5 mg/kg, ISOF 10 mg/kg, DEX 5 mg/kg. Compared with control group #P<0.05, ###P<0.001. Compared with LPS group, *P<0.05, ***P<0.001. Compared with LPS+DEX group, and P<0.05, and P<0.01; compared with LPS+ISOF group, $P<0.05, $$$P<0.01 (n=4). Compared by one-way analysis of variance or Kruskal–Wallis or one-way analysis of variance on ranks followed by Student–Newman–Keuls test.
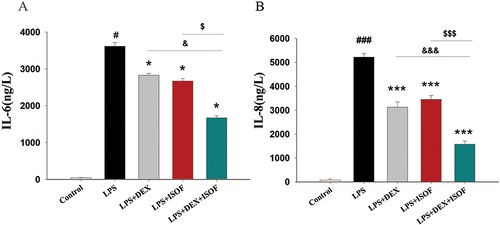
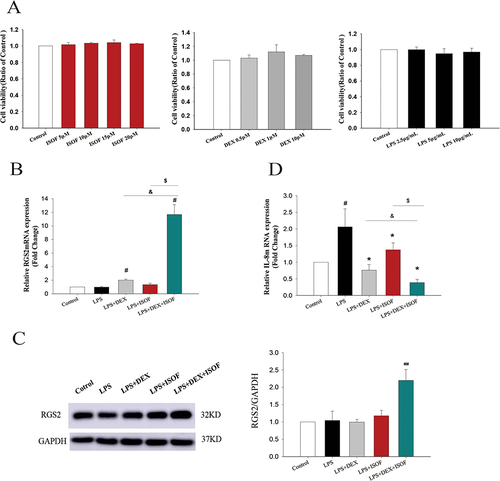
Figure 5 Effects of ISOF, DEX and the combination of both on LPS-induced inflammation in a BEAS-2B cell model. (A) The effect of ISOF, DEX and LPS on cell viability of BEAS-2B cells. (B) Regulatory effects of ISOF and DEX on LPS-induced RGS2 mRNA expression in BEAS-2B cells. (C) Regulatory effects of ISOF and DEX on LPS-induced RGS2 protein expression in BEAS-2B cells. (D) Regulatory effects of ISOF and DEX on LPS-induced IL-8 mRNA expression in BEAS-2B cells. All of the above experiments were at least greater than or equal to three independent replicates. Compared with control group #P<0.05, ##P<0.01. Compared with LPS group, *P<0.05. Compared with LPS+DEX group, and P<0.05; compared with LPS+ISOF group, $P<0.05. Compared by one-way analysis of variance or Kruskal–Wallis or one-way analysis of variance on ranks followed by Student–Newman–Keuls test.