
Figures & data
Table 1 Comparison of Baseline Characteristics and Laboratory Parameters Between Patients with Non Acute Myocardial Infarction Patients (Non-AMI) and ST-Segment Elevation Myocardial Infarction (STEMI) at Admission
Figure 1 Study flow chart. 468 patients were diagnosed with ST-segment elevation acute myocardial infarction on admission. (A). 42 patients who also had routine blood tests on admission, 6–12 h after PCI, 24–48 h after PCI, and at discharge were screened; (B). A total of 216 patients with both routine blood tests on admission, 12 h after PCI, and at discharge were screened.
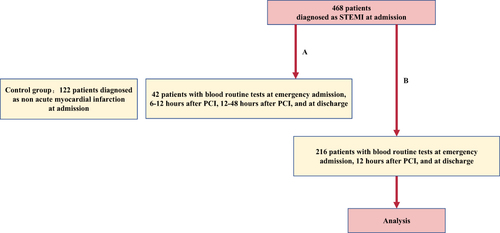
Figure 2 Trajectory of dynamic change in white blood cell count from admission to discharge in patients with ST-segment elevation acute myocardial infarction. (A). Trajectories of white blood cell counts in 42 patients with ST-segment elevation myocardial infarction during admission, 6–12 hours after PCI, 24–48 hours after PCI, and at discharge; (B). Trajectories of white blood cell counts in 216 patients with ST-segment elevation myocardial infarction during admission, 12 hours after PCI, and at discharge. (N, number of patients with white blood cells determinations; #Mean ± SD; *Median (interquartile range)).
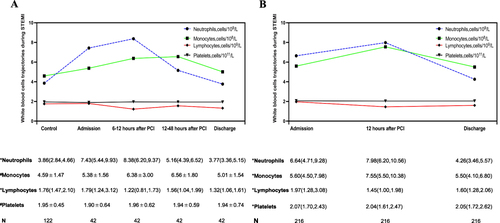
Table 2 Dynamic Trajectories of SII, SIRI, and PIV from Admission to Discharge in Patients with STEMI
Figure 3 Trajectory of the dynamic changes of inflammatory markers SII, SIRI, and PIV from admission to discharge in patients with ST-segment elevation myocardial infarction. Trajectory of SII (A), SIRI (B), and PIV (C) dynamics in 42 patients with ST-segment elevation myocardial infarction (Mann–Whitney U-test P < 0.05, Friedman test and Bonferroni post hoc test adjusted P < 0.05). Box-and-whisker plot showing dynamic change trends for SII (D), SIRI (E), and PIV(F) in 216 patients with ST-segment elevation myocardial infarction (Friedman test and Bonferroni post hoc test adjusted P < 0.05). Boxes indicate 25–75% interquartile range; horizontal lines in boxes, median width; whiskers, 10–90% range; dots, detected outliers that reside outside the whisker range. Bolded values indicate higher levels of inflammatory markers SII, SIRI, and PIV in patients with STEMI at admission compared to the non acute myocardial infarction (control group). In patients with STEMI, the expression levels of inflammatory markers SII, SIRI, and PIV were higher 6–12 or 12 hours after PCI compared to admission and discharge.
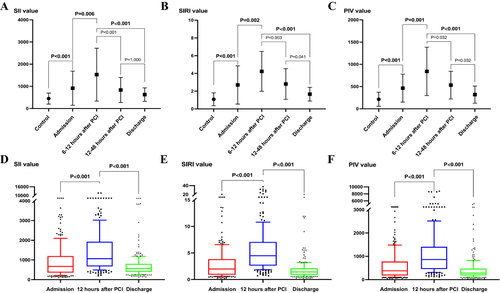
Table 3 Clinical Outcomes at 1-Year Follow-Up After PCI for ST-Segment Elevation Myocardial Infarction (STEMI)
Table 4 Basic Clinical Characteristics Between MACEs Groups and Non-MACEs Groups in Patients with STEMI
Figure 4 Differential values of the inflammatory markers SII, SIRI, and PIV between the major cardiovascular adverse events (MACEs) and non-MACEs groups at different time points and between different time points (Mann–Whitney U-test P < 0.05). (A). Differential values of SII between MACEs and non-MACEs groups; (B). Differential values of SIRI between MACEs and non-MACEs groups; (C). Differential values of PIV between MACEs and non-MACEs groups; (D). Differential values of SII changes between MACEs and non-MACEs groups; (E). Differential values of SIRI changes between MACEs and non-MACEs groups; (F). Differential values of PIV changes between MACEs and non-MACEs groups.
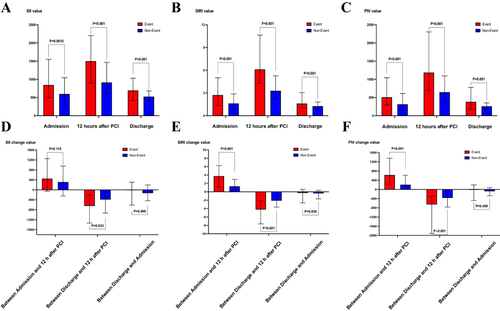
Table 5 Univariate and Multivariable Cox Proportional Hazard Regression Analysis of MACEs Occurrence Within 1 Year of Hospital Discharge in Patients with ST-Segment Elevation Myocardial Infarction (STEMI) After PCI
Table 6 Correlation Between General Clinical Characteristics, Angiographic Characteristics and SIRI in Patients with ST-Segment Elevation Myocardial Infarction (STEMI)
Table 7 The Optimal Cut-off Value and Area Under the Receiver Operating Characteristic Curve (ROC) of Inflammatory Markers SII, SIRI and PIV and Their Dynamically Fluctuating Changes Between Each Time Point to Predict the Occurrence of Major Adverse Cardiac Events (MACEs) Within 1 Year of Discharge in Patients with ST-Segment Elevation Myocardial Infarction (STEMI) After PCI
Figure 5 Receiver operating characteristic (ROC) curves. (A). ROC curve for SIRI at 12 hours after PCI to predict the major cardiovascular adverse events (MACEs); (B). ROC curve for PIV at 12 hours after PCI to predict the MACEs.
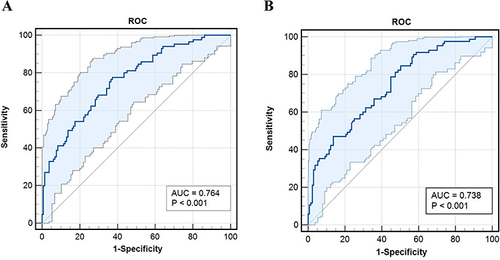
Figure 6 Kaplan–Meier survival analysis. (A). Patients with a high SIRI value (SIRI ≥ 4.15) had a much lower event-free survival at long-term follow-up than patients with a low SIRI value (SIRI < 4.15); (B). Patients with a high PIV (PIV ≥ 622.71) had a much lower event-free survival at long-term follow-up than patients with a low PIV (PIV < 622.71).
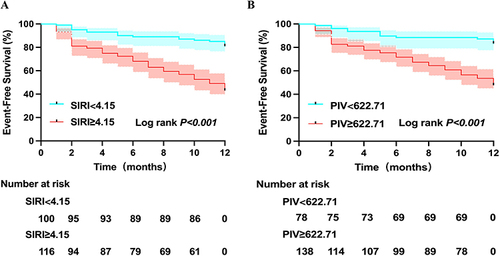
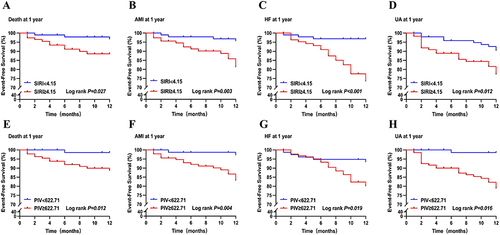
Figure 7 Kaplan–Meier survival analysis. (A). Patients with a high SIRI value (SIRI ≥ 4.15) had a much higher mortality rate at long-term follow-up than patients with a low SIRI value (SIRI < 4.15); (B). Patients with a high SIRI value (SIRI ≥ 4.15) had a much higher new-onset nonfatal acute myocardial infarction (AMI) rate at long-term follow-up than patients with a low SIRI value (SIRI < 4.15); (C). Patients with a high SIRI value (SIRI ≥ 4.15) had a much higher congestive heart failure (HF) rate at long-term follow-up than patients with a low SIRI value (SIRI < 4.15); (D). Patients with a high SIRI value (SIRI ≥ 4.15) had a much higher revascularization in unstable angina (UA) rate at long-term follow-up than patients with a low SIRI value (SIRI < 4.15); (E). Patients with a high PIV (PIV ≥ 622.71) had a much higher mortality rate at long-term follow-up than patients with a low PIV (PIV < 622.71); (F). Patients with a high PIV (PIV ≥ 622.71) had a much higher new-onset nonfatal acute myocardial infarction (AMI) rate at long-term follow-up than patients with a low PIV (PIV < 622.71); (G). Patients with a high PIV (PIV ≥ 622.71) had a much higher congestive heart failure (HF) rate at long-term follow-up than patients with a low PIV (PIV < 622.71); (H). Patients with a high PIV (PIV ≥ 622.71) had much a higher revascularization in unstable angina (UA) rate at long-term follow-up than patients with a low PIV (PIV < 622.71).
Data Sharing Statement
Data from this study are available from the corresponding author upon request.