Figures & data
Figure 1 The research flowchart of bioinformatic analysis and in vivo experimental validation.
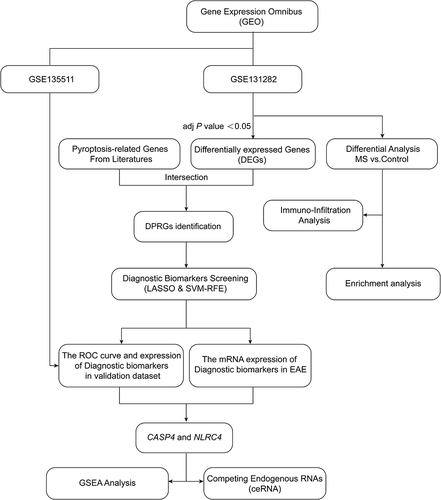
Table 1 Primers Used for Quantitative Reverse Transcriptase Polymerase Chain Reaction (qRT-PCR)
Figure 2 Comparing and analyzing the immune cells infiltration in the MS patients and the controls. (A)The fraction of immune cells in each control sample. (B) The fraction of immune cells in each MS sample. Different color of the bars indicated different immune cell populations. The length of the bars indicated the proportions of the immune cell populations, and the sum of the proportion of various immune cell populations in each sample was 1. (C) The difference of immune cell infiltration in gray matter between the MS patients and the controls. The MS group was shown in pink and the control group was shown in blue.
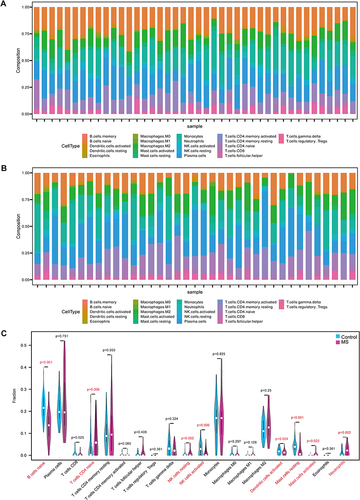
Figure 3 Differential analysis. (A) The volcano plot was generated to visualize up-regulated differentially expressed genes (DEGs) vs down-regulated DEGs in the MS patients and the controls. (B) The heatmap showed the 25 tops DEG which were related the MS patients and the controls.
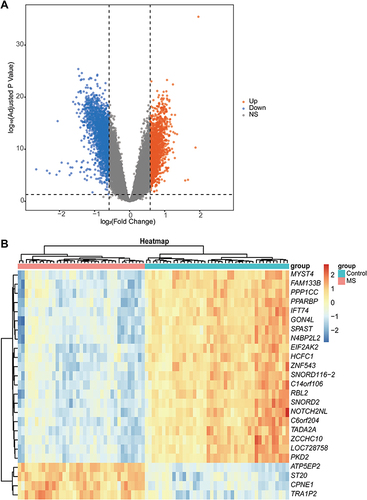
Figure 4 Functional enrichment analysis using GSVA. (A) The top 10 upregulated pathways and top 10 downregulated pathways of GSVA result for GO terms are presented. (B) The top 10 upregulated and downregulated significantly enriched KEGG pathways.
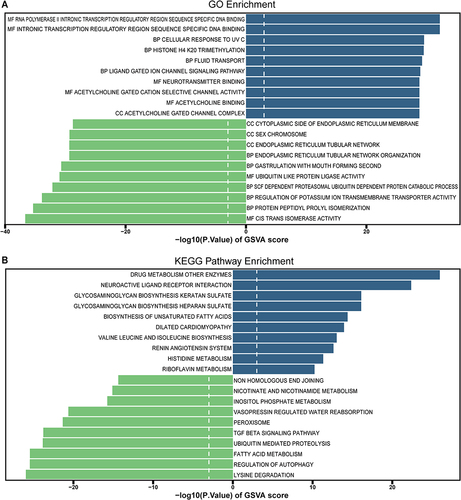
Figure 5 The Receiver operating characteristic (ROC) of the hub pyroptosis-related genes for predicting the patients with MS. (A) ROC curve in the training set (GSE131282 dataset). (B) ROC curve analysis of the validation set (GSE135511 dataset).
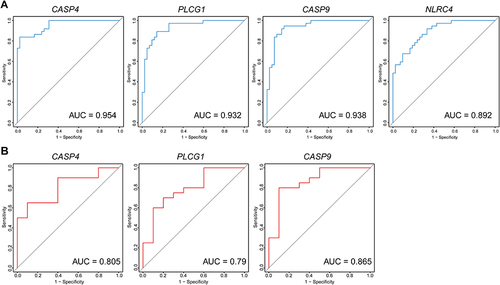
Figure 6 Identifying the statistical difference of gene expression estimated by qRT-PCR Assays. Total RNA was isolated from was extracted from cortical tissue of the EAE model (n=6) and the control model (n=6). The expressions of CASP4 (A) and NLRC4 (B) were upregulated in the EAE model compared with the control group (P<0.05). However, the expression of CASP9 (C) and PLCG1 (D) were not statistically significant. *P < 0.05.
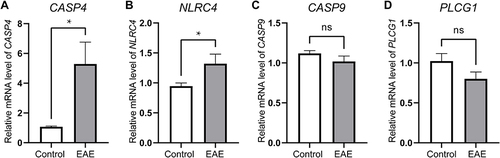
Figure 7 Single-gene GSEA pathway analysis of hub pyroptosis-related genes. (A) The five tops significant enriched pathways of CASP4 were ascorbate and aldarate metabolism, steroid hormone biosynthesis, pentose and glucuronate interconversions porphyrin metabolism, and drug metabolism-cytochrome P450. (B) The five tops downregulated pathways of CASP4 were 2-Oxocarboxylic acid metabolism, DNA replication, mannose type O-glycan biosynthesis, aminoacyl-tRNA biosynthesis, and mismatch repair. (C) The five tops significant enriched pathways of NLRC4 were staphylococcus aureus infection, autoimmune thyroid disease, asthma, hematopoietic cell lineage, and allograft rejection. (D) The five tops downregulated pathways of NLRC4 were autophagy-other, long-term potentiation, RNA polymerase, protein export and circadian rhythm.
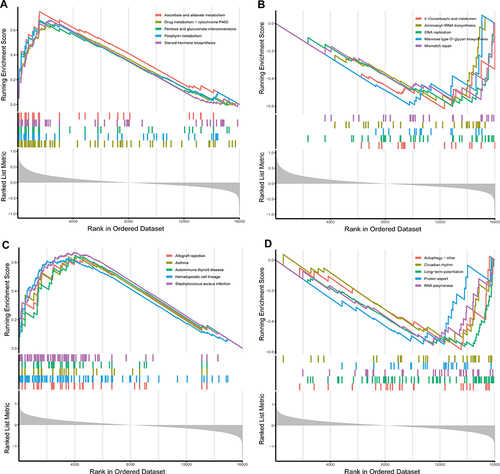
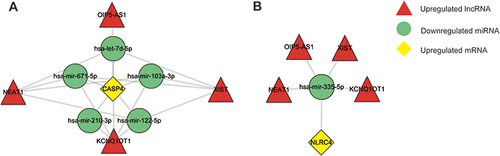
Figure 8 Sankey diagram for the competing endogenous RNA (ceRNA) network of the nine top-most predicted lncRNAs. Each rectangle represented a lncRNA/miRNA/gene, and the size of the rectangle represented the connection degree of each lncRNA/miRNA/gene.
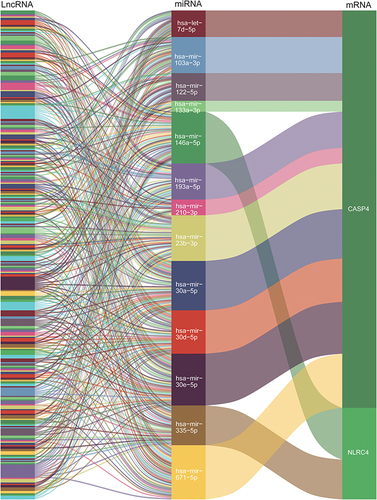
Figure 9 The competing endogenous RNA (ceRNA) networks and the potential RNA regulatory pathways of hub pyroptosis-related genes. (A) ceRNA network of mRNA for CASP4. (B) ceRNA network of mRNA for NLRC4.