Figures & data
Figure 1 Determination of SOD content (n = 20, ). Compared within the control group and before treatment, *P < 0.05, compared within the HBO group and before treatment, **P < 0.01; Compared within the HBO group after treatment with that in the control group, #P < 0.05.
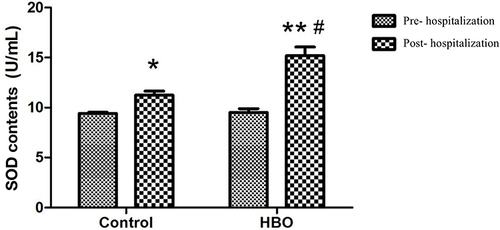
Figure 2 Determination of MDA content (n = 20, ). Compared within the control group and HBO group as well as before treatment, *P < 0.05; Compared within the HBO group after treatment with that in the control group, #P < 0.05.
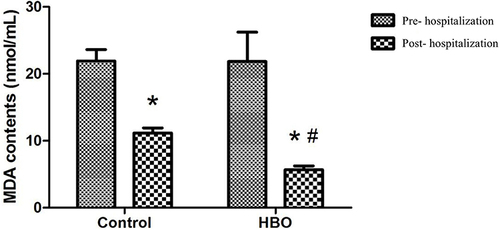
Figure 3 Determination of NO content (n = 20, ). Compared within the group before treatment, *P < 0.05, **P < 0.01.
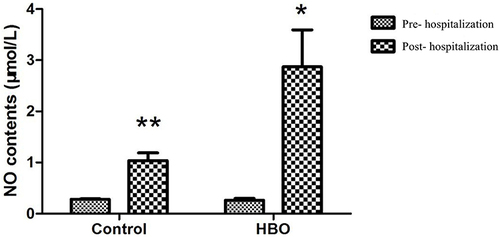
Figure 4 NGF standard curve.
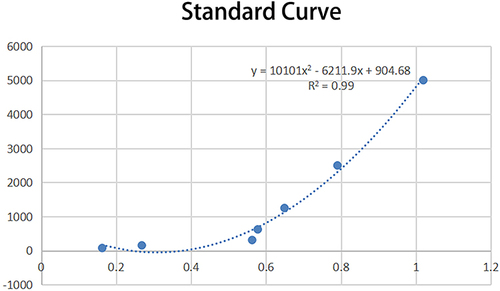
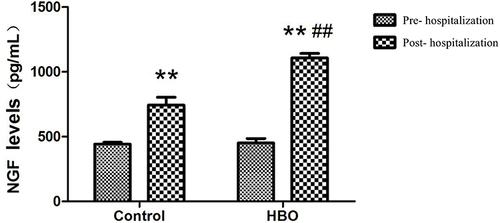
Figure 5 Determination of NGF content (n = 20, ). Compared with the control group after treatment, ##P < 0.01; compared to the same group before treatment, **P < 0.01.