Figures & data
Figure 1 Diagram of the study population.
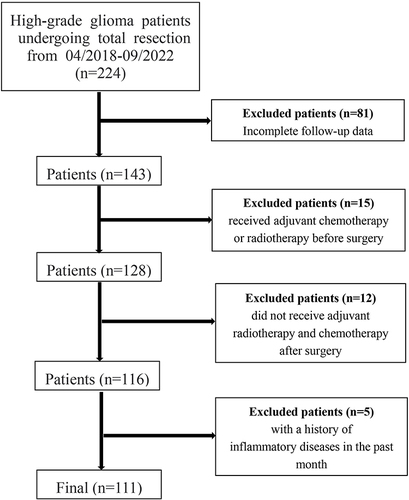
Table 1 The Demographic, Radiological and Laboratorial Characteristics of the Patients
Table 2 The Demographic, Radiological and Laboratorial Characteristics of the Low SII and High SII Patients
Table 3 Assessment of Potential Risk Factors for Early Recurrence of Gliomas
Figure 2 Comparison of the AUCs for NLR, MLR, PLR, SII and SIRI in predicting early recurrence of glioma in HCG patients.
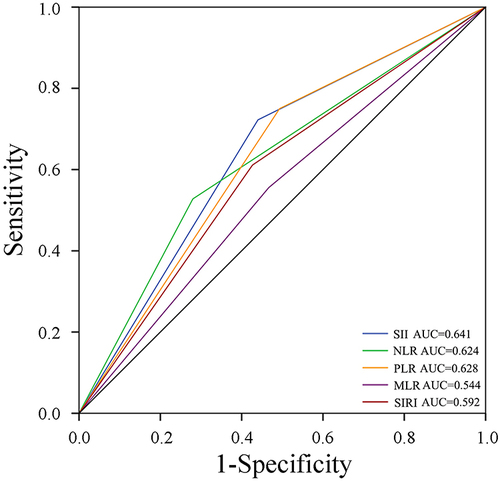
Table 4 Demographic, Radiological and Laboratorial Characteristics of the Patients After Propensity Score Matching
Figure 3 Log rank tests were used to compare PFS (A) and OS (B) between high SII and low SII groups before PSM.
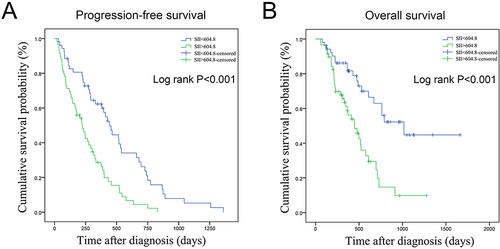
Figure 4 Log rank tests were used to compare PFS (A) and OS (B) between high SII and low SII groups after PSM.
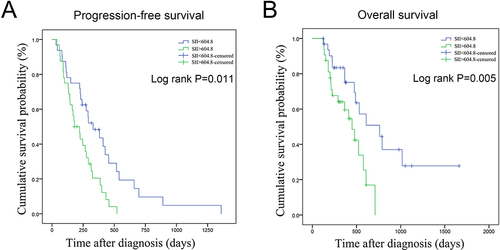
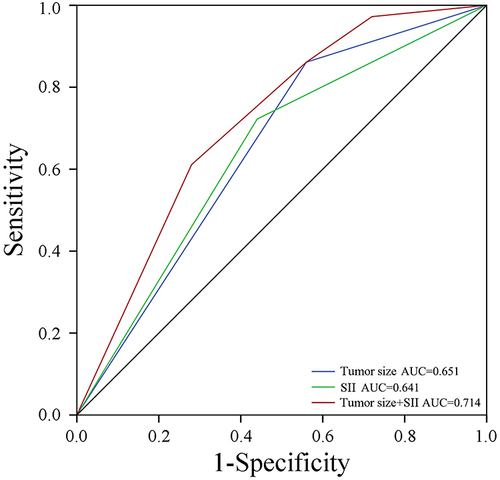
Figure 5 Comparison of the AUCs for SII, tumor size and the combination of SII and tumor size in predicting early recurrence of glioma in HCG patients.