Figures & data
Figure 1 Carotid artery ultrasonography and aorta sampling in ApoE−/− mice. (A) B-ultrasound and Doppler images of the left carotid artery of mice were collected and imported into the VevoLAB3.2.6 system to calculate the vascular resistance index (RI). The red arrow points to the left carotid artery of the ApoE−/− mice under ultrasound. (B) Carotid artery ultrasonography showed that RI in AS22W was significantly higher than that in the other three groups (P<0.0001) (ns p≥0.05, ****p<0.0001). (C) Stripping the hearts and aortas. The red arrow points to the aortic atheromatous plaque of the ApoE−/− mice in AS22W group under direct vision.
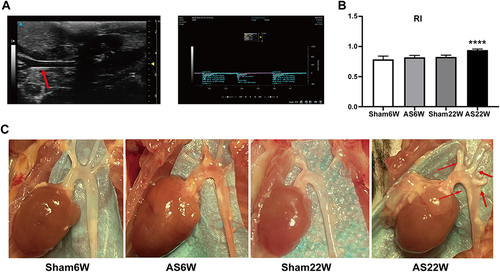
Table 1 Gene-Specific Primers Used for Real-Time RT-PCR
Figure 2 Aortic gross oil red O staining.
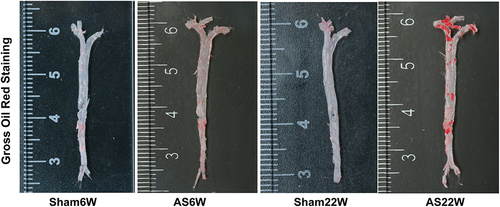
Figure 3 Histological and immunohistochemical characterization of plaques in the aortic sinus. (A) Representative micrographs of oil red O staining, MASSON staining, HE staining and immunofluorescence double staining of CD68 (green particles) and α-SMA (red particles) in frozen sections of aortic sinus of ApoE-/- mice; Objective magnification 4×. (B and C) The plaque area ratio of the aortic sinus stained by oil red O and HE was calculated by Image J. (D and E) Quantification of extracellular matrix and macrophages, using ImageJ to calculate the percentage of positive area to total plaque area. (*p<0.05, ***p<0.001, ****p<0.0001).
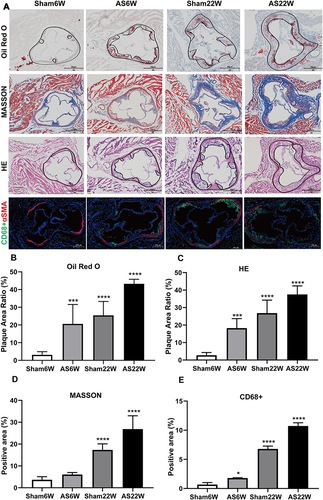
Figure 4 Blood Lipids. (A) the levels of TC; (B) the levels of TG; (C) the levels of LDL-C. Due to the effect of WD, the levels of LDL-C, TC, and TG in the AS22W group were significantly higher than those in the other three groups (** p<0.01,****p<0.0001).
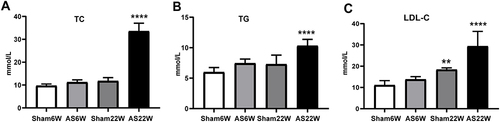
Figure 5 Difference analysis. (A) Difference analysis of volcano maps of AS6w and Sham6W groups. (B) Heat maps of top 5 differentially high/low expression genes in AS6w and Sham6W groups. (C) PCA of AS6w group and Sham6W group; (D) Difference analysis volcano maps of AS22w and Sham22W groups. (E) Heat maps of top 5 differentially high/low expression genes in AS22w and Sham22W groups. (F) PCA of AS22w and Sham22W groups.
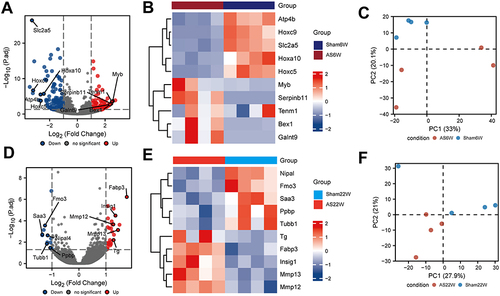
Figure 6 PPI network construction. (A) PPI networks of DEGs in AS22w and Sham22W groups. (B) Top 9 hub genes based on PPI network.
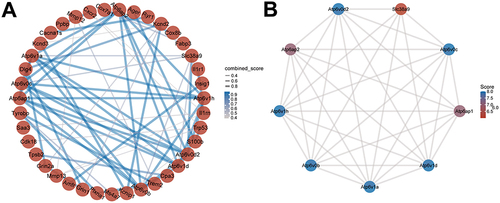
Figure 7 The expression of Hub genes. (A) Expression of Hub genes in AS6w group and Sham6W group. (B) Expression of Hub genes in AS22w group and Sham22W group. (C) Expression of Hub genes in the GSE100927 dataset of carotid atherosclerotic lesion group and normal carotid artery group (ns p≥0.05;*p< 0.05;***p<0.001).
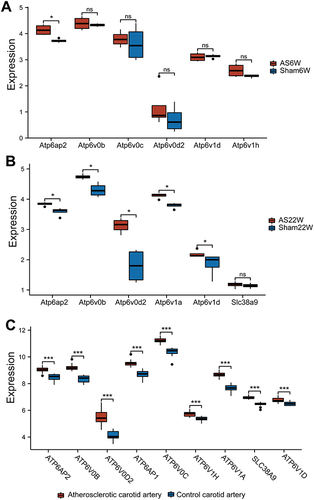
Figure 8 Construction of related regulatory network. (A) mRNA-TF regulatory network. (B) mRNA-RBP regulatory network. (C) mRNA-Chemical network.
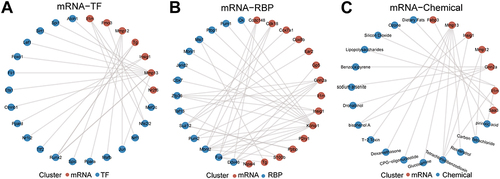
Table 2 GO Enrichment Analysis
Table 3 GSEA Enrichment Analysis
Table 4 KEGG Signaling Pathway
Figure 9 GO and KEGG enrichment analysis of DEGs. (A–C) GO analysis based on differential genes of AS22W group and Sham22W group. ((A) Biological Process. (B) Cellular Component. (C) Molecular Function). (D) KEGG (Kyoto Encyclopedia of Genes and Genomes) enrichment analysis based on differential genes of AS22W group and Sham22W group.
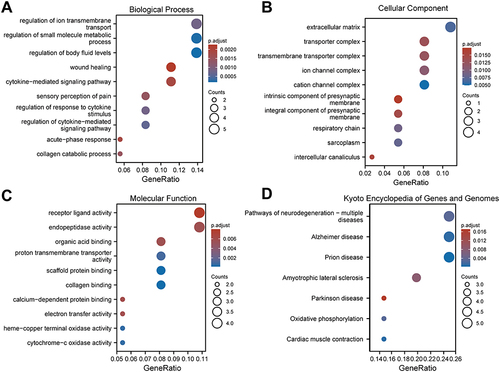
Figure 10 GSEA analysis. (A) KEGG FATTY ACID METABOLISM. (B) KEGG PEROXISOME. (C) WP AMINO ACID METABOLISM. (D) KEGG PPAR SIGNALING PATHWAY. (E) WP FERROPTOSIS. (F) KEGG TRYPTOPHAN METABOLISM. (G) KEGG PROTEASOME. (H) PID INTEGRIN2 PATHWAY.
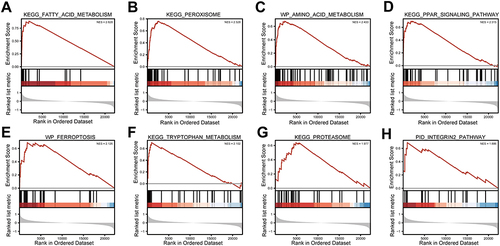
Table 5 GSVA Enrichment Analysis
Figure 11 GSVA Enrichment analysis. (A and B) Enrichment pathway in AS22w group and Sham22W difference analysis box map and heat map (ns p≥0.05, *p< 0.05, **p<0.01, *** p<0.001).
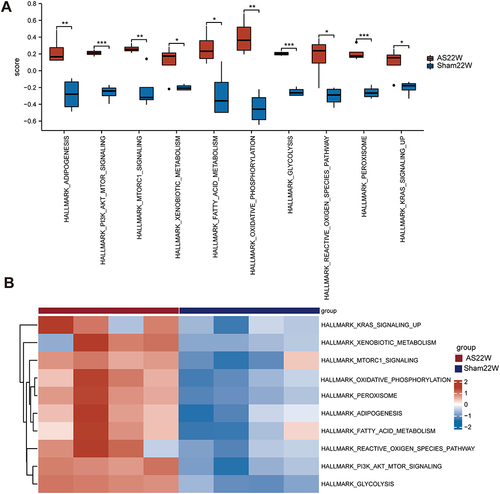
Figure 12 Immunoassay. (A) Abundance of immune cells in AS22w and Sham22W samples. (B) Heat map of correlation between Hub genes and levels of immune cell infiltration (*p< 0.05).

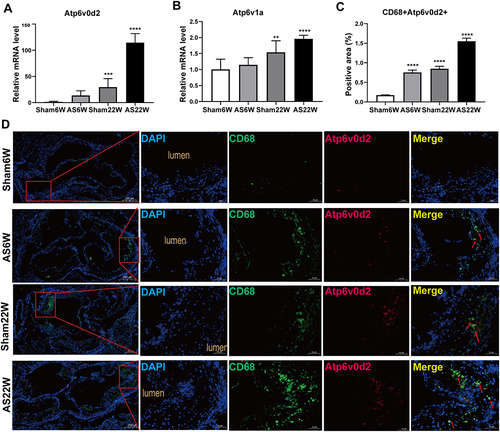
Figure 13 (A and B) Gene expression of Atp6v0d2, Atp6v1a in aorta of mice in each group (**p<0.01, ***p<0.001, ****p<0.0001). (C) The proportion of positive area of co-localization of CD68 and Atp6v0d2 by immunofluorescence double staining of aortic sinus (****p<0.0001). (D) Representative immunofluorescence analysis for detecting the colocalization (yellow particles) of CD68 (specific for monocyte macrophages, green particles) and Atp6v0d2 (red particles) in frozen sections from the aortic sinus of ApoE−/− mice; red arrow: the co-localization of CD68 and Atp6v0d2; Objective magnification 4×, 18×.