Figures & data
Figure 1 (A) NUP62CL mRNA expression in normal and OSCC tumor tissues. (B) NUP62CL mRNA expression in OSCC tumor tissues and their paired normal tissue. (C) Patients with high NUP62CL expression had a poor prognosis. ***P < 0.001.
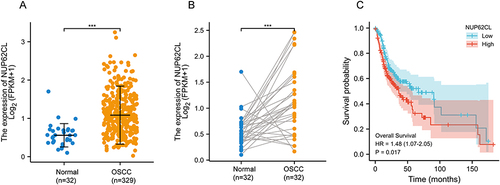
Figure 2 The multiplex immunohistochemistry revealed the expression of the NUP62CL protein in tumor tissues (A) and normal tissues (B).
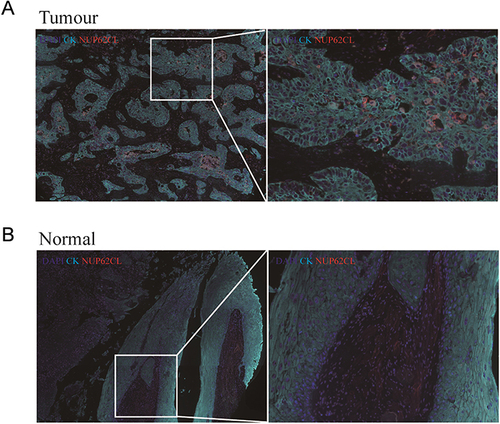
Table 1 Relationship Between NUP62CL Expression and Clinicopathological Features
Figure 3 Univariate and multivariable analyses of prognostic factors for 5-year survival in patients with OSCC. *P<0.05, **P<0.01, ***P<0.001.
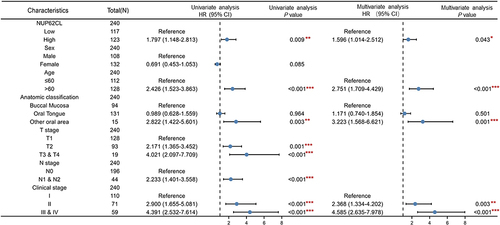
Figure 4 The impacts of NUP62CL expression levels (A), age (B), anatomic classification (C), T stage (D), N stage (E) and clinical stage (F) on the overall survival of OSCC patients.
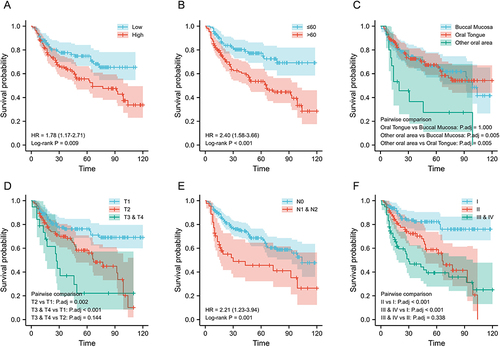
Figure 5 (A) The group comparison diagram represents the proportions of 24 distinct immune cell types. (B) NUP62CL expression was correlated with tumor-infiltrating immune cells (TIICs) abundance. *P<0.05, **P<0.01, ***P<0.001.
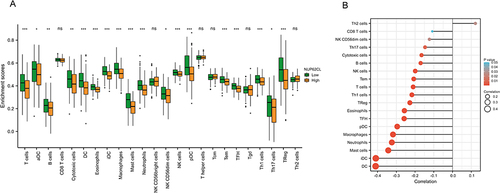
Figure 6 (A) Representative multiplex immunofluorescence staining images detecting different immune cell types in OSCC tissues. (B) The infiltration levels of TIICs in OSCC. (C) NUP62CL expression was related to TIICs abundance. *P<0.05, **P<0.01.
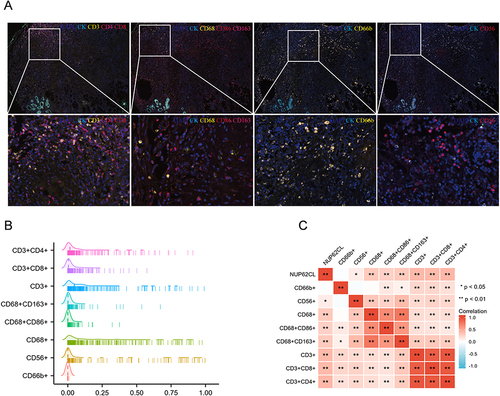
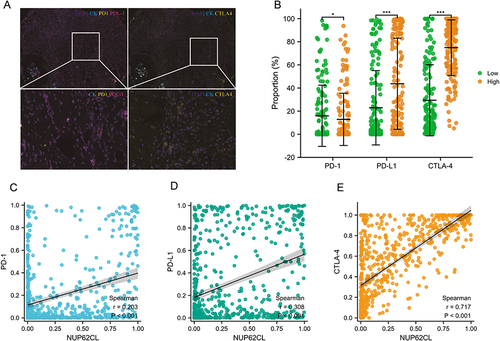
Figure 7 (A) The representative mIHC images of PD-1, PD-L1 and CTLA-4 protein expression. (B) The PD-1, PD-L1 and CTLA-4 protein expression in NUP62CL high-expression and low-expression groups. The correlation of NUP62CL protein expression with the immune checkpoints in OSCC tissues, including PD-1 (C), PD-L1 (D) and CTLA-4 (E). *P<0.05, ***P<0.001.