Figures & data
Table 1 Clinical Characteristics of the Study Participants
Figure 1 The grouping design and analysis flowchart.
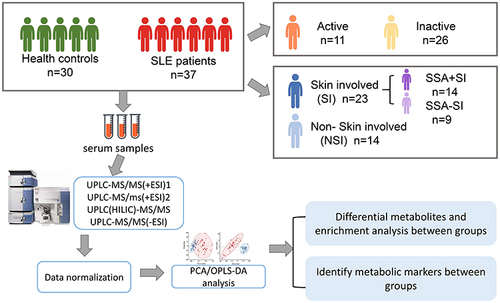
Figure 2 Serum metabolomic analysis between SLE group and HC group. (A) PCA analysis plot and (B) OPLS-DA analysis plot of SLE and HC. (C) Component composition of differential metabolites and (E) lipids. (D) The heat map shows 325 differential metabolites between SLE and HC. (F) Pathway enrichment map for 325 differential metabolites.
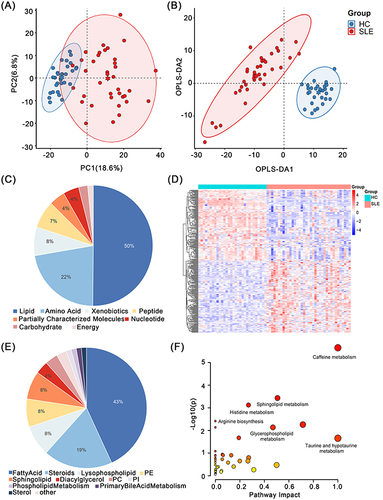
Figure 3 Serum metabolomic analysis between Active group and Inactive group. (A) PCA analysis plot and (B) OPLS-DA analysis plot of these two groups. (C) Component composition of differential metabolites and (E) lipids. (D) Pathway enrichment map for differential metabolites between these two groups. (F) Correlation analysis of differential metabolites and SLEDAI scores, 12 positive metabolites were selected based on Cor value and P value. ***P<0.001.
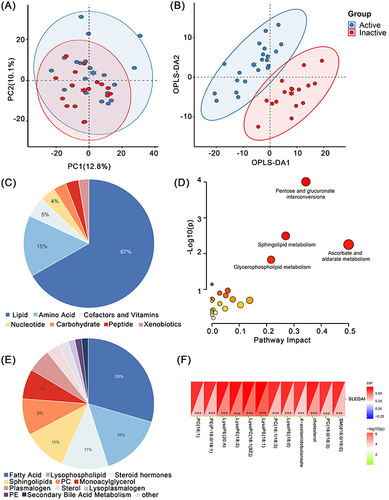
Figure 4 Serum metabolomic analysis between SI group and NSI group. The composition of (A) differential metabolites and (B) lipids between SI, NSI and HC. (C) Wayne diagram of differential metabolites between SI, NSI and HC, thus identifying 118 differential metabolites belonging to SI. (D) Pathway enrichment map of 118 differential metabolites. (E) ROC curves and (F) expression differences of N-acetylglutamine, N-acetylphenylalanine and fumarate between SI and NSI, HC. NS: P>0.05. * 0.01<P<0.05, **0.001<P<0.01, ***P<0.001.
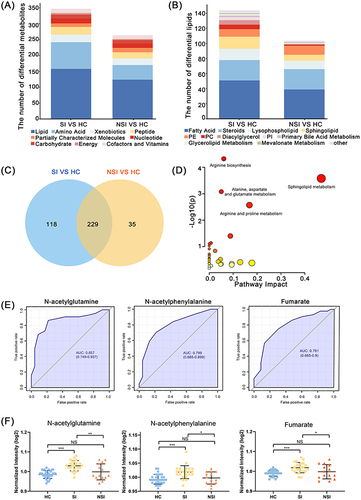
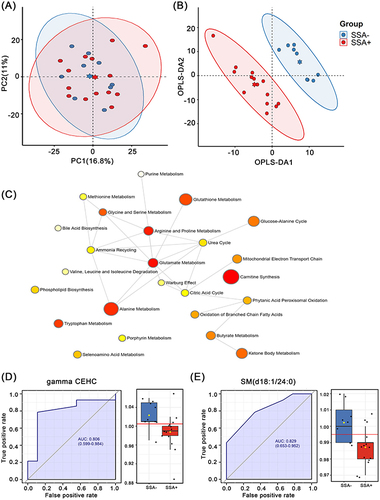
Figure 5 Serum metabolomic analysis between SSA+SI group and SSA-SI group. (A) PCA analysis plot and (B) OPLS-DA analysis plot of these two groups. (C) Pathway enrichment plots for the 27 differential metabolites between these two groups. ROC curves of (D) gamma-CEHC and (E) SM (d18:1 / 24:0) and expression levels in these two groups.