Figures & data
Table 1 Chiu Scale for Intestinal Damage Assessment
Figure 1 Representative histological slices of small intestine sections stained with hematoxylin/eosin: control group (A), intestinal ischemia-reperfusion injury (non-treated) (B), and animals treated with α-tocopherol (C), curcumin (D), 5 µg/kg dexmedetomidine (E), and 20 µg/kg dexmedetomidine (F). Control animals (A) show a well-preserved intestinal mucosal structure, where crypts and villi are well distinguished. The non-treated group (B) shows massive lifting of the epithelial layer around the whole villus (red asterisk), with complete loosening of the microvilli (black arrow); in addition, there is increased cellularity of the lamina propria, which is still preserved (black arrowhead). In treated animals (C–F), a subepithelial space starts to emerge (red arrow), known as Gruenhagen’s spaces, the extent of which increases the greater the intestinal damage (red arrowhead). Each bar represents the mean value and standard deviation.
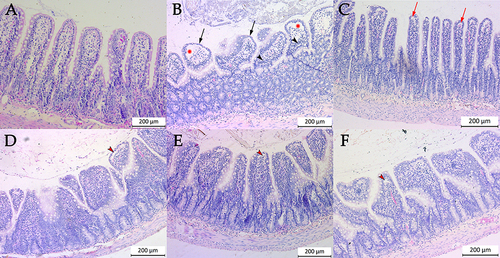
Figure 2 Histological injury degree (HID) score of small bowel samples submitted to ischemia-reperfusion injury: non-treated (i–IRI, white) or treated with α-tocopherol (ATF, light gray), curcumin (CUR, dark gray), low dose of dexmedetomidine (DEX5, square pattern), and normal dose of dexmedetomidine (DEX20, lined pattern). The asterisks reflect the statistical differences compare to non-treated group (****p < 0.0001). The significance levels shown inside the frame indicate the differences compared to the control group (healthy animals non-subjected to ischemia): #p < 0.05; ###p < 0.001; ####p < 0.0001; ns: p > 0.05. The dotted line represents the HID score of non-ischemic intestines (control group). Each bar represents the mean value and standard deviation.
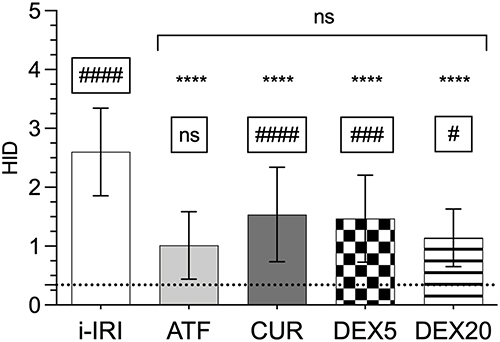
Figure 3 Histological injury degree (HID) score of the mesenteric (A) and antimesenteric (B) border of the tissue subjected to ischemia-reperfusion injury: non-treated (i–IRI, white) or treated with α-tocopherol (ATF, light gray), curcumin (CUR, dark gray), low dose of dexmedetomidine (DEX5, square pattern), and normal dose of dexmedetomidine (DEX20, lined pattern). The asterisks reflect the statistical differences compare to non-treated group (*p < 0.05; **p < 0.01; ***p < 0.001; ns: p > 0.05). The significance levels shown inside the frame indicate the differences compared to the control group (healthy animals non-subjected to ischemia): #p < 0.05; ##p < 0.01; ####p < 0.0001; ns: p > 0.05. The dotted line represents the HID score of non-ischemic intestines (control group). Each bar represents the mean value and standard deviation.
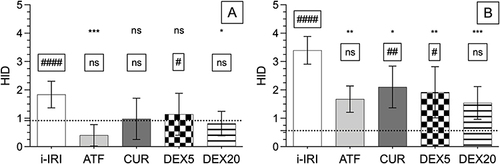
Table 2 Biochemical Serum Values (Mean and Standard Deviation) of Alanine Transaminase (ALT), Aspartate Transaminase (AST), Creatinine, Urea, Creatine Kinase (CK) and Lactate Dehydrogenase (LDH). Levels are Expressed in International Units of Activity per Liter (IU/l) for ALT, AST, CK, and LDH; and in Milligrams per Deciliter (Mg/Dl) for Creatinine and Urea. The Values are Shown as the Mean and Standard Deviation
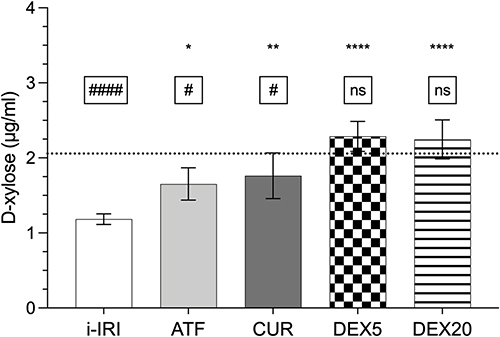
Figure 4 D-xylose absorption test. Results are expressed as µg/mL of D-xylose in serum 1 h after oral D-xylose administration in animals subjected to ischemia-reperfusion injury: non-treated (i–IRI, white) or treated with α-tocopherol (ATF, light gray), curcumin (CUR, dark gray), low dose of dexmedetomidine (DEX5, square pattern), and normal dose of dexmedetomidine (DEX20, lined pattern). The asterisks reflect the statistical differences compare to non-treated group (*p < 0.05; **p < 0.01; ****p < 0.0001; ns: p > 0.05). The significance levels shown inside the frame indicate the differences compared to the control group (healthy animals non-subjected to ischemia): #p < 0.05; ####p < 0.0001; ns: p > 0.05. Each bar represents the mean value and standard deviation.