
Figures & data
Table 1 Primer Sequence for Real-Time PCR
Table 2 Differentially Expressed miRNAs
Figure 1 HK-2 cell cytotoxicity and apoptosis induced by diquat.
Notes: (A) Cell viability. HK-2 cells were cultured in a cell medium with diquat (0, 20, 40, 60, 80, 100, and 120 μmol/L) for 24 h, and cell viability was measured by CCK-8 assay. (B and C) Cell apoptosis rate. HK-2 cells were cultured in a cell medium with diquat (0, 40, 80, and 120 μmol/L) for 24 h. Flow cytometry was used to detect the apoptosis rate of HK-2 cells by double staining of Annexin V and PI. Data is presented as mean ± SD of three or more independent experiments, *P<0.05 and **P<0.001 with respect to the CTRL group, and #P<0.05 with respect to the diquat group, indicating statistical significance by one-way ANOVA and post-hoc Tukey’s test.
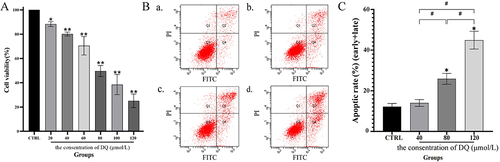
Figure 2 Inter-sample correlation, principal components, and public and unique sequence analysis.
Notes: (A) Correlation coefficient plot between samples. (B) The plot of the ratio analysis of shared and unique sequences between samples. (C) A principal component analysis algorithm used to analyze the samples.
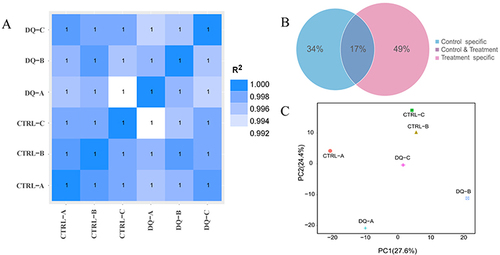
Figure 3 Profiles of the DE miRNAs. HK-2 cells were cultured in a medium containing 80 μmol/L diquat or an equivalent amount of PBS for 24 h.
Notes: (A) Volcano plot of miRNAs. (B) Scatter plot of differences in miRNAs between samples. (C) Heat map of DE miRNAs in HK-2 cells. |log2(FoldChange)| > 1, P value <0.05 relative to the CTRL group. (D) Histogram of RT-qPCR results. U6 normalized miRNA expression. Values are expressed as the mean ± SD, with *P value <0.05, diquat treatment group vs CTRL group.
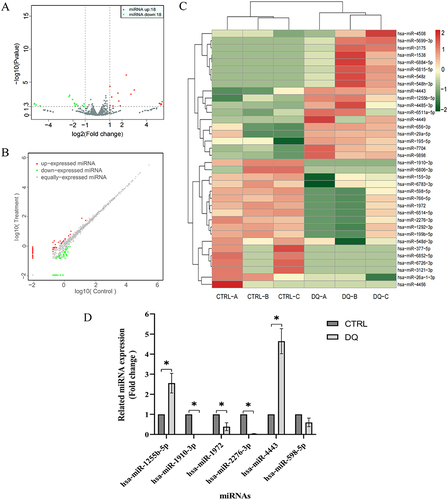
Figure 4 Results of GO and KEGG analyses visualized by imageGP platform.
Notes: (A–C) Enrichment plot of GO analysis. (D) Pathway analysis enrichment plot for KEGG. Q-value < 0.05.
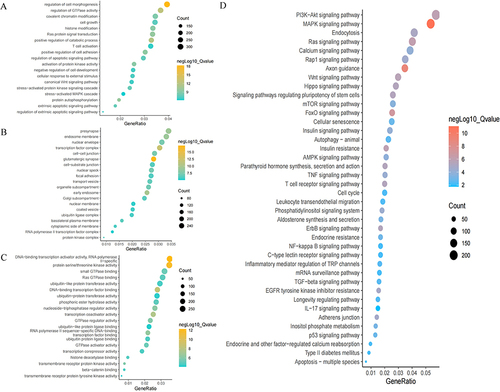
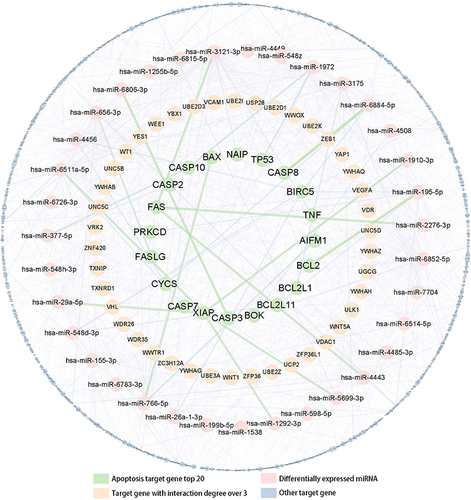
Figure 5 Essential target genes and network regulation map visualized by Cytoscape_v3.6.1 software.
Notes: The regulatory network was drawn based on the previous target gene prediction results. The Top20 candidate target genes associated with apoptosis were indicated by green circles, the differentially expressed miRNAs by pink circles, and the target gene with interaction degree over 3 by orange circles. The strength of the association was indicated by the line thickness.
Data Sharing Statement
The datasets used and/or analysed during the current study available from the corresponding author on reasonable request.