Figures & data
Table 1 Gradient Elution Condition
Table 2 Effects on Apparent Scores of Rats in Burn Injury Model
Figure 1 Effect on the burn area of rats. (a) Pictures of rats with burns at different time periods. (b–d) Burn area at different time periods. (e) Healing rate of burns (100%). **P < 0.01 vs BG group. ##P < 0.01 vs MG group.
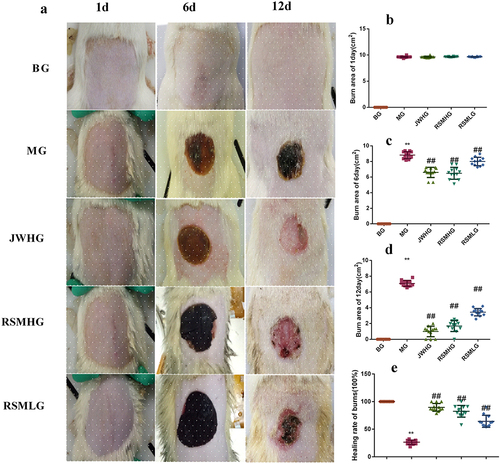
Figure 2 Effects on blood perfusion of burn tissue. (a) Pictures of blood perfusion volume at different time periods. (b–d) Burn area at different time periods. **P < 0.01 vs BG group. ##P < 0.01, #P < 0.05 vs MG group.
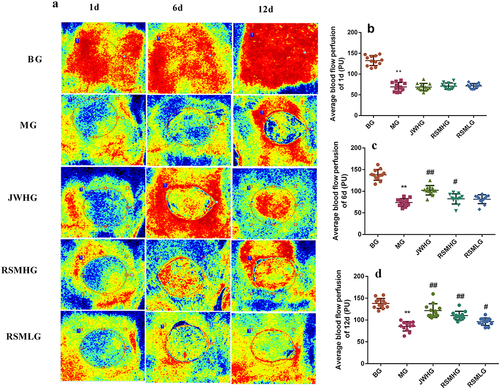
Figure 3 Effect of serum biochemical indicators. (a–c) Levels of inflammatory cytokines. (d) Levels of collagen.(e–f) Levels of growth factors. **P < 0.01 vs BG group. ##P < 0.01 vs MG group.
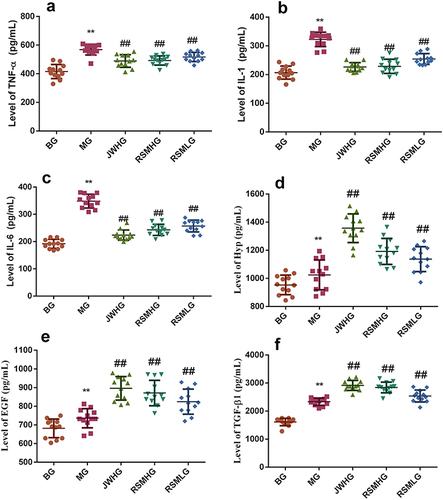
Figure 4 Effect on histopathological changes. (a) Pathological photos of HE staining (×100). (b) Description of grading criteria. (c) Ridit test. **P < 0.01 vs BG group. ##P < 0.01 vs MG group.
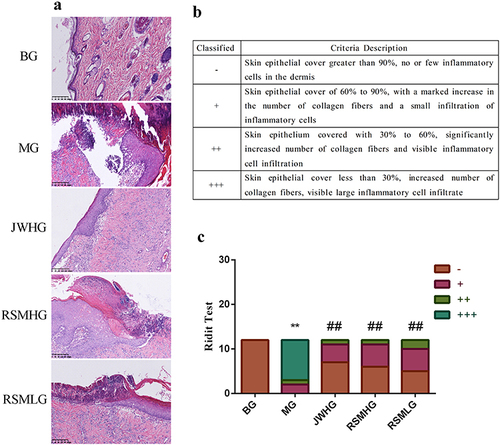
Figure 5 Effect on protein expression of growth factor. (a) Immunohistochemistry pictures (×400). (b–e) Protein expression of growth factor. **P < 0.01 vs BG group. ##P < 0.01, #P < 0.05 vs MG group.
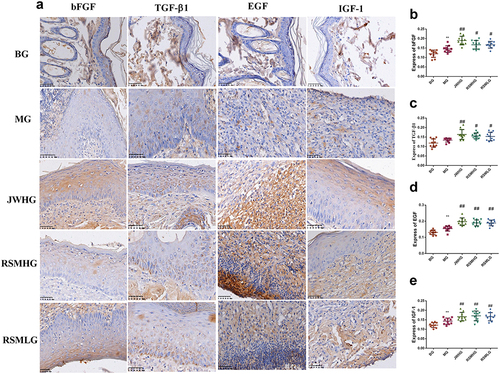
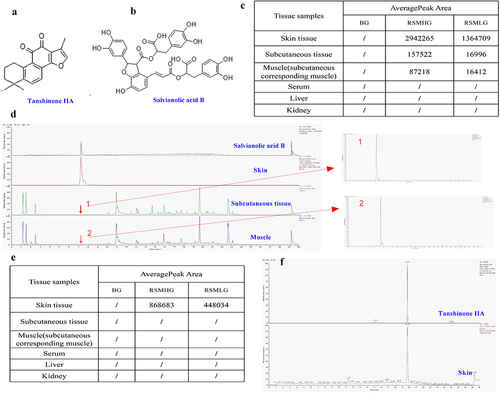
Figure 6 Absorption of tanshinone IIA and salvianolic acid B in different tissues. (a) Molecular structure of tanshinone IIA. (b) Molecular structure of salvianolic acid B. (c) Absorption in different tissues of salvianolic acid B. (d) UHPLC -LTQ- Orbitrap- MS of salvianolic acid B in biological samples. (e) Absorption in different tissues of tanshinone IIA. (f) UHPLC-LTQ-Orbitrap-MS of tanshinone IIA in biological samples.