Figures & data
Figure 1 Flow chart showing the selection of patients.
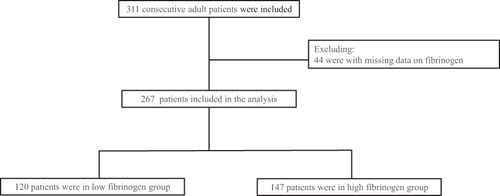
Table 1 Clinical Characteristics Between the Two Groups
Table 2 Biochemical and Coronary Characteristics Between the Two Groups
Figure 2 Kaplan–Meier survival curves estimated MACEs for patients between the two groups in the whole cohort.
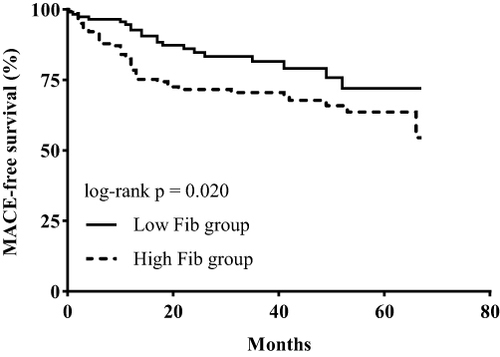
Figure 3 Subgroup analyses for the MACEs. HRs and 95% CIs were calculated by reference to the low fibrinogen group using cox regression analysis.
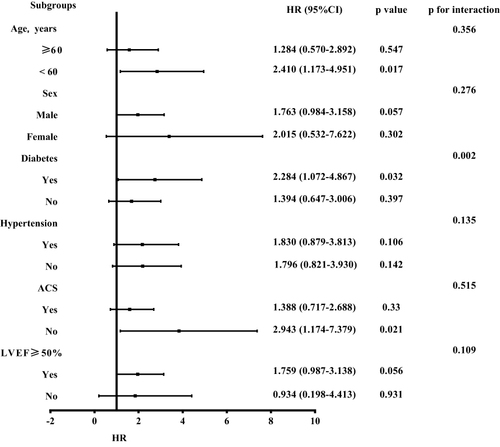
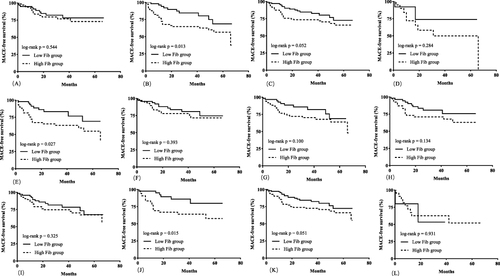
Figure 4 Kaplan–Meier survival curves estimated MACEs in subgroups. (A) survival curves for the MACEs in patients with age ≥ 60 years; (B) survival curves for the MACEs in patients with age < 60 years; (C) survival curves for the MACEs in men; (D) survival curves for the MACEs in women; (E) survival curves for the MACEs in patients with diabetes; (F) survival curves for the MACEs in patients without diabetes; (G) survival curves for the MACEs in patients with hypertension; (H) survival curves for the MACEs in patients without hypertension; (I) survival curves for the MACEs in patients admitted for ACS; (J) survival curves for the MACEs in patients who were not admitted for ACS; (K) survival curves for the MACEs in patients with LVEF ≥ 50%; (L) survival curves for the MACEs in patients with LVEF < 50%.