Figures & data
Figure 1 XJDHT prevents sepsis-induced cardiac dysfunction. Cardiac function in mice administered LPS (LPS, 10 mg/kg) or equivalent saline solution (control) then treated with XJDHT (10g/kg/d) or saline by gavage for 72 h (n = 5). (A) Representative echocardiographic images. (B) Ejection fraction (EF). (C) Fractional shortening (FS). All values are presented as the mean ± SD; *P < 0.05 LPS+NS vs control group, #P < 0.05 LPS+XJDHT vs LPS+NS group.
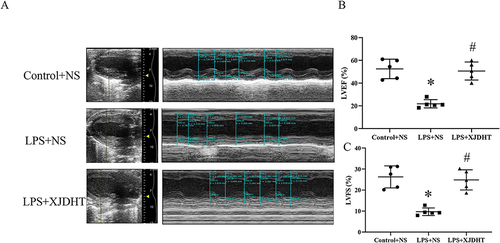
Figure 2 XJDHT improves sepsis-induced myocardial pathological changes. (A) Hematoxylin and eosin staining (n = 5; scale bar = 50 µm; magnification, x400). All values are presented as the mean ± SD; *P < 0.05 LPS+NS vs control group; #P < 0.05 LPS+NS + XJDHT vs LPS group. (B) ELISA demonstrated reduced serum levels of TNF-α, cTnI, and IL-1β following treatment with XJDHT. (C and D) Western blotting to determine levels of TLR4 and NF-κb after XJDHT treatment. *P < 0.05 LPS+NS vs control group; #P < 0.05 LPS+NS + XJDHT vs LPS group.
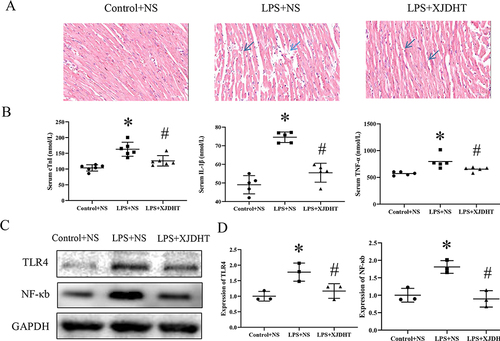
Figure 3 Genome-wide gene expression profiling of cardiac tissues from mice with sepsis after XJDHT treatment. (A) Volcano plots comparing gene expression profiles (fold change ≥ 2, P < 0.05). (B) Overlapping areas represent genes under-expressed in the LPS group but over-expressed in the LPS + XJDHT group (n = 206) and genes over-expressed in the LPS group but under-expressed in the LPS + XJDHT group (n = 324). (C) KEGG pathway enrichment analysis of differentially expressed transcripts for LPS+NS vs control and LPS+XJDHT vs LPS+NS. (D) Overlapping KEGG pathways for LPS+NS vs control and LPS+XJDHT vs LPS+NS.
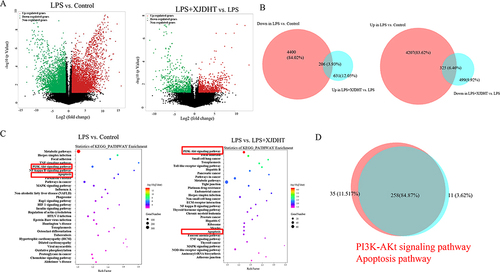
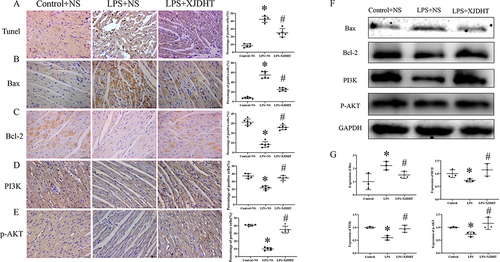
Figure 4 Attenuation of sepsis-induced myocardial cell apoptosis by XDJHT is partially mediated by suppression of the PI3K/AKT signaling pathway. (A) Apoptosis detected by TUNEL assay. (B-E) Immunohistochemical staining for Bax, Bcl2, PI3K and p-AKT in myocardial tissue. Scale bar: 50 μm. All values are presented as the mean ± SD; *P < 0.05 for LPS+NS vs control group, #p < 0.05 for LPS+XJDHT vs LPS+NS group.(F and G) Western blotting to determine levels of Bax,Bcl-2,PI3K and p-AKT after XJDHT treatment in myocardial tissue.*P < 0.05 LPS+NS vs control group; #P < 0.05 LPS+NS + XJDHT vs LPS group.