
Figures & data
Table 1 General Characteristics of Study Participants
Table 2 Linear Regression Analysis Evaluating the Differences in Cytokines, Oxidative Stress Markers and Telomere Length (TL) Between ISA Vs ISS After Correcting for Potential Confounders
Table 3 Linear Regression Analysis Evaluating the Differences in Cytokines, Oxidative Stress Markers and Telomere Length (TL) Between IRA Vs IRS After Correcting for Potential Confounders
Figure 1 Comparing levels of serum IL-10 (a) and IL-6 (b) cytokines among ISS, ISA, IRS and IRA groups. Linear regression analysis evaluating the differences among the studied groups after correcting for age, BMI, gender, and fasting time. Data are presented as Mean±SEM. p* <0.05.
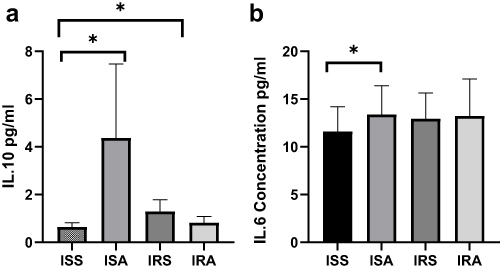
Figure 2 Comparing level of SOD among ISS, ISA, IRS and IRA groups (a) and between active and sedentary (b). Linear regression analysis evaluating the differences among the studied groups after correcting for age, BMI, gender, and fasting time. Data are presented as Mean±SEM. p* <0.05.
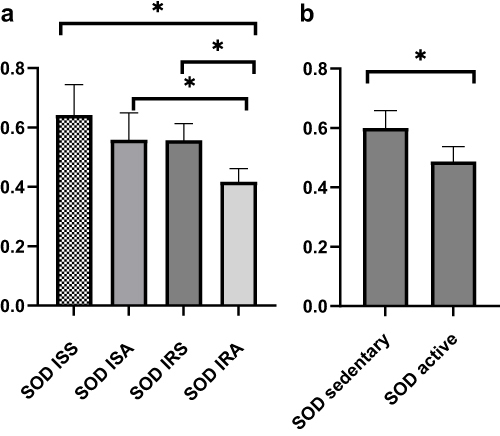
Figure 3 Comparing DNA telomere length among ISS, ISA, IRS and IRA groups. Linear regression analysis evaluating the differences among the studied groups after correcting for age, BMI, gender, and fasting time. Data are presented as Mean±SEM.
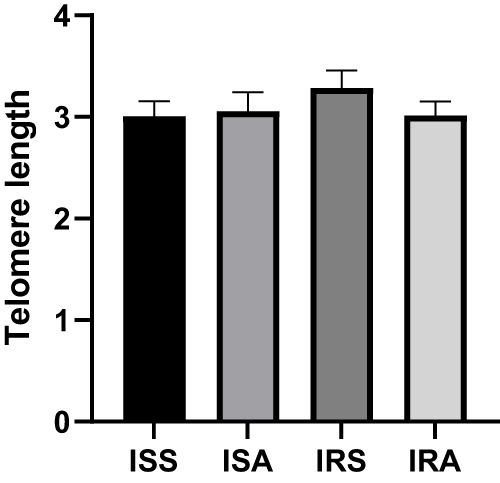
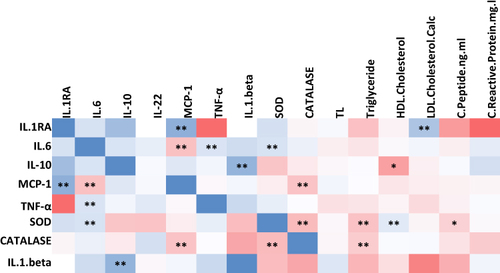
Figure 4 Heatmap representing significant correlations among cytokines, oxidative stress markers and telomere length measured in the whole cohort (n = 368). Correlation coefficient range (0–1) is color-coded (blue) and range (−1-0) is color-coded red. Correlations were made using Spearman correlation analysis (* p ≤ 0.05, ** p ≤ 0.01).
Data Sharing Statement
Data are available from the corresponding author upon reasonable request.