
Figures & data
Figure 1 The flow diagram of developing and validating the prediction model.
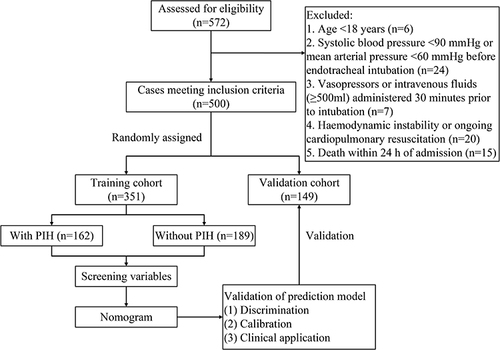
Table 1 Comparison of Clinical Characteristics of Patients with PIH and Non-PIH in the Training Cohort
Figure 2 Variable selection using the least absolute shrinkage and selection operator (LASSO) binary logistic regression model. (A) The tuning parameter (λ) in the LASSO model was selected for 10-fold cross-validation by the minimum criteria. The dotted vertical lines were drawn at the best values using the minimum criteria and 1 standard error of the minimum criteria (the 1-SE criteria). A λ value of 0.056, with log (λ), −2.883 was chosen (1-SE criteria) according to 10-fold cross-validation. (B) LASSO coefficient curves of the 40 variables. A coefficient profile plot was produced against the log (λ) sequence. Vertical line was drawn at the value selected using 10-fold cross-validation, where optimal λ resulted in 7 non-zero coefficients.
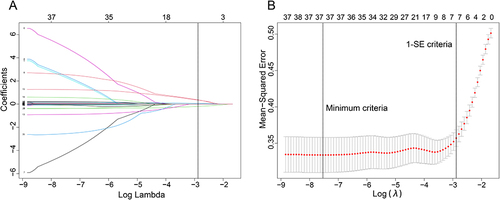
Figure 3 Multivariable logistic regression demonstrating the association of variables with PIH.
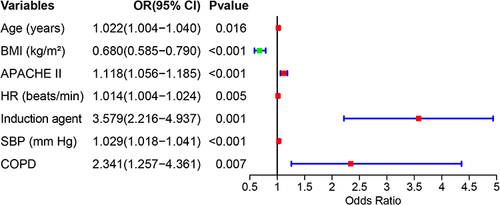
Figure 4 Nomogram for predicting the risk of PIH in critically ill patients. The patient was 86 years old and had a history of COPD. Prior to endotracheal intubation the patient’s BMI was measured at 18.99 kg/m2, heart rate was 139 beats/min, systolic blood pressure was 120 mmHg and APACHE II score was 14. Additionally, an induction agent was used prior to endotracheal intubation. The patient’s score was 392 and the probability of a hypotensive event after intubation was 82.9%.
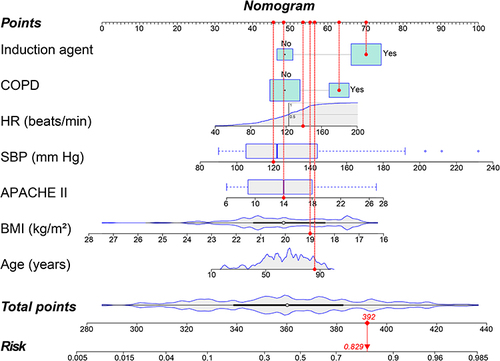
Figure 5 Discrimination and calibration of nomogram prediction models in the training and validation cohorts. (A) Calibration plot in the training cohort. (B) Calibration plot in the validation cohort. (C) ROC curves in both the training and validation cohorts.
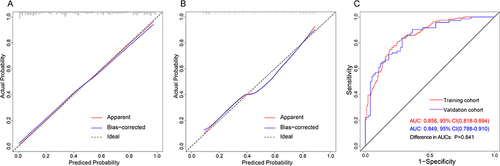
Figure 6 Evaluation of clinical utility of nomogram prediction models in the training and validation cohorts. (A) Decision curves in both the training and validation cohorts. (B) Clinical impact curve in the training cohort. (C) Clinical impact curve in the validation cohort.
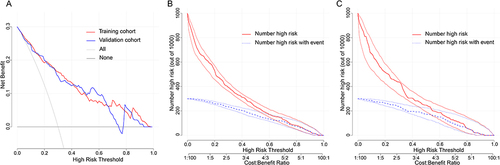
Table 2 Outcomes in Patients with or Without Post-Intubation Hypotension
Figure 7 Cumulative mortality in patients with tracheal intubation based on Kaplan-meier curves. (A) Cumulative mortality in all patients with tracheal intubation. (B) Comparison of cumulative mortality in post-intubation hypotensive patients and non-post-intubation hypotensive patients.
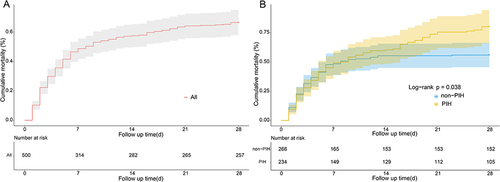
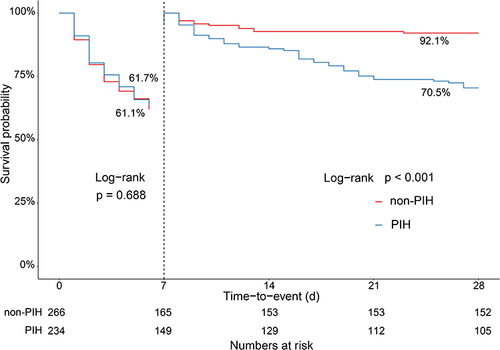
Figure 8 Comparison of 7-day and 28-day mortality in tracheally intubated patients.
Data Sharing Statement
The datasets for this manuscript will be made available upon request, further inquiries can be directed to the corresponding author Yu Cao, [email protected].