Figures & data
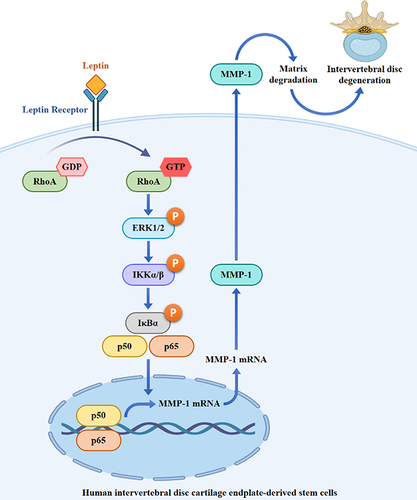
Figure 1 Effect of leptin on MMP-1 expression. (A–C) SV40 cells were exposed to 100 ng/mL of leptin for 6–24 hours. Subsequently, the MMP-1 protein expression in both cell lysates (A) and supernatants (B) was assessed through Western blotting. Additionally, (C) the MMP-1 protein expression in supernatants was quantified using ELISA. (D) In a separate experiment, SV40 cells were incubated with 100 ng/mL leptin for 2–24 hours, and the MMP-1 mRNA expression was determined via RT-real-time PCR. Data from the ELISA and RT-real-time PCR are presented as means ± SD from three distinct experiments. Images obtained from Western blotting are representative of individual experiments. The significance of the findings is denoted by ***p < 0.001 when compared to control cells.
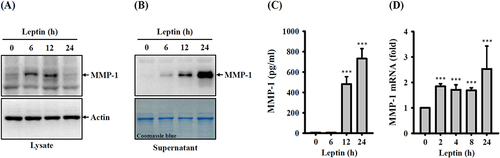
Figure 2 Effect of RhoA on leptin-induced MMP-1 expression. (A) SV40 cells were exposed to 100 ng/mL of leptin for 15–60 minutes, and the levels of GTP-bound RhoA were assessed through pull-down and Western blotting. (B) To investigate the effect of Rhosin, SV40 cells were first incubated with Rhosin for 0.5 hours, followed by incubation with 100 ng/mL of leptin for 2 hours. Subsequently, MMP-1 mRNA expression was determined using RT-real-time PCR. (C) For a similar investigation, SV40 cells were first incubated with Rhosin for 0.5 hours, followed by incubation with 100 ng/mL of leptin for 24 hours. The MMP-1 protein expression in supernatants was then analyzed through Western blotting. Data obtained from RT-real-time PCR is presented as the means ± SD from three separate experiments. The Western blotting images are representative of individual experiments. The significance of the findings is indicated by ***p < 0.001 when compared to leptin-activated cells.
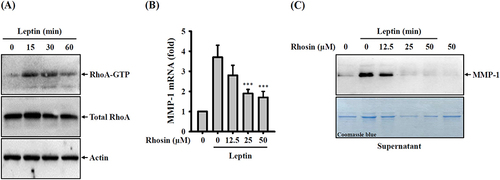
Figure 3 Effect of ERK1/2 on leptin-induced MMP-1 expression. (A-C) SV40 cells were treated with 100 ng/mL of leptin for 15–60 minutes. Subsequently, the phosphorylation levels of ERK1/2 (A), JNK1/2/3 (B), and p38 (C) in cell lysates were assessed through Western blotting. (D) To investigate the impact of PD98059, SV40 cells were pre-incubated with PD98059 for 0.5 hours, followed by treatment with 100 ng/mL of leptin for 2 hours. The subsequent analysis focused on MMP-1 mRNA expression, which was evaluated via RT-real-time PCR. (E) In a similar experimental setup, SV40 cells were pre-incubated with PD98059 for 0.5 hours, followed by exposure to 100 ng/mL of leptin for 24 hours. This time, the analysis involved MMP-1 protein expression in supernatants, assessed using Western blotting. (F) In a different series of experiments, SV40 cells were treated with 100 ng/mL of leptin for 15–60 minutes, and the phosphorylation levels of AKT in cell lysates were examined through Western blotting. Data derived from RT-real-time PCR is presented as the means ± SD from three separate experiments. The Western blotting images represent individual experiments. Findings indicating significance are marked as *p < 0.05 and ***p < 0.001 in comparison to leptin-activated cells.
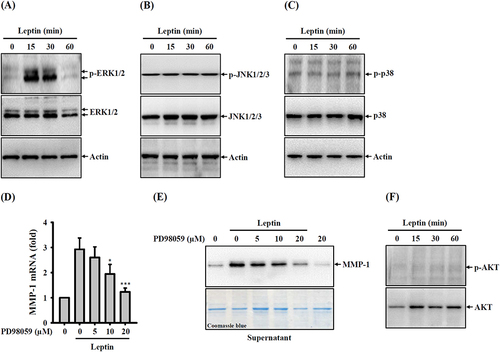
Figure 4 Effect of NF-κB on leptin-induced MMP-1 expression. (A–C) SV40 cells were exposed to 100 ng/mL of leptin for 15–60 minutes. Following this, phosphorylation levels of IKKα/β (A), IκBα (B), and NF-κB p65 (C) in cell lysates were examined via Western blotting. (D) For an extended treatment period, SV40 cells were incubated with 100 ng/mL of leptin for 2–6 hours, and the MMP-1 protein expression in both cytosolic and nuclear fractions was evaluated through Western blotting. (E) Investigating the impact of PDTC, SV40 cells were pre-treated with PDTC for 0.5 hours, followed by incubation with 100 ng/mL of leptin for 2 hours. The subsequent analysis focused on MMP-1 mRNA expression, assessed using RT-real-time PCR. (F) In a related experiment, SV40 cells were pre-treated with PDTC for 0.5 hours, followed by exposure to 100 ng/mL of leptin for 24 hours. The analysis centered on MMP-1 protein expression in supernatants and was assessed by ELISA. (G) Another pre-treatment experiment involved SV40 cells being incubated with SN50 for 0.5 hours, followed by incubation with 100 ng/mL of leptin for 24 hours. MMP-1 protein expression in supernatants was examined through Western blotting. (H) A separate pre-treatment study had SV40 cells being incubated with NAC for 0.5 hours, followed by exposure to 100 ng/mL of leptin for 24 hours. The analysis focused on MMP-1 protein expression in supernatants and was assessed by Western blotting. (I) In a different pre-treatment setup, SV40 cells were exposed to DPI for 0.5 hours, followed by incubation with 100 ng/mL of leptin for 24 hours. The subsequent analysis involved the assessment of MMP-1 protein expression in supernatants and was conducted through Western blotting. Data from ELISA and RT-real-time PCR are presented as the means ± SD from three separate experiments. The Western blotting images represent individual experiments. Findings denoting significance are marked as *p < 0.05 and ***p < 0.001 in comparison to leptin-activated cells.
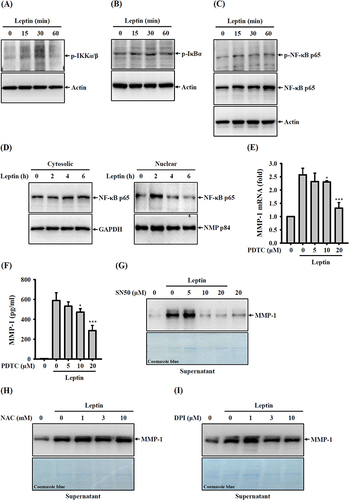
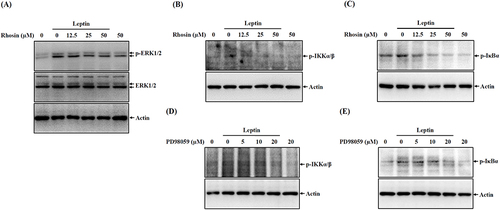
Figure 5 Leptin activates NF-κB through RhoA-ERK1/2 axis. (A–C) SV40 cells were pre-treated with Rhosin for 0.5 hours, followed by incubation with 100 ng/mL of leptin for 30 minutes. Subsequently, the phosphorylation levels of ERK1/2 (A), IKKα/β (B), and IκBα (C) in cell lysates were examined through Western blotting. (D and E) In a similar experimental setup, SV40 cells were pre-treated with Rhosin for 0.5 hours, followed by exposure to 100 ng/mL of leptin for 30 minutes. The subsequent analysis focused on the phosphorylation levels of IKKα/β (D) and IκBα (E) in cell lysates, which were assessed using Western blotting. The Western blotting images represent individual experiments.