Figures & data
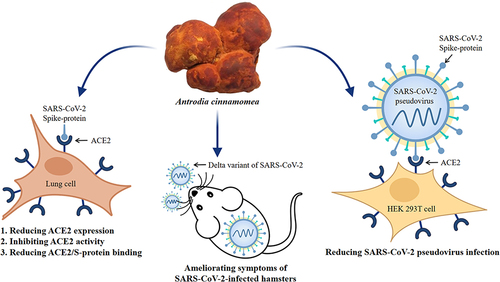
Figure 1 Chemical structure of pure compounds identified in AC. Antcin A (1), Antcin B (2), Antcin C (3), Antcin H (4), Antcin K (5), Dehydrosulphurenic acid (6), and Dehydroeburicoic acid (7).
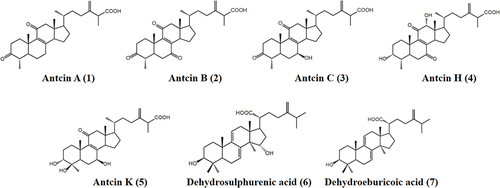
Figure 2 Effect of AC on ACE2 expression and the interaction between the spike protein and cells. (A) Dose-response study of AC-mediated downregulation of ACE2 protein in CL1-5 cells. (B) Time course study of AC-mediated downregulation of ACE2 protein in CL1-5 cells. (C) Time course study of AC-mediated downregulation of ACE2 mRNA in CL1-5 cells. (D) Effect of AC on the LDH release in CL1-5 cells. (E) Dose‒response study of AC-mediated downregulation of ACE2 protein in MRC-5 cells. (F) Effect of AC on the binding between the SARS-CoV-2 spike protein and CL1-5 cells. The mRNA data and binding assay are expressed as the means ± SDs of the three separate experiments, and the Western blot images show representative results. * and *** indicate significant differences at levels of p<0.01 and p<0.001, respectively, compared to control cells or as indicated.
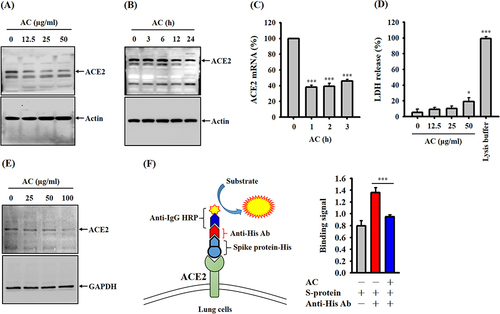
Figure 3 Effects of pure AC compounds on ACE2 protease activity. (A) HPLC analysis of the triterpenoid profiles of AC. (B) Effects of pure AC compounds on ACE2 protease activity. (C) Michaelis‒Menten plots of ACE2 protease activities are shown for different concentrations of DA to determine the inhibitory constant (Ki) using GraphPad Prism software. (D) Effect of DA on the binding between the SARS-CoV-2 spike protein and CL1-5 cells. The ACE2 inhibition data and binding assay are expressed as the means ± SDs of the three separate experiments. *, ** and *** indicate significant differences at levels of p<0.05, p<0.01 and p<0.001, respectively, compared to control cells or as indicated.
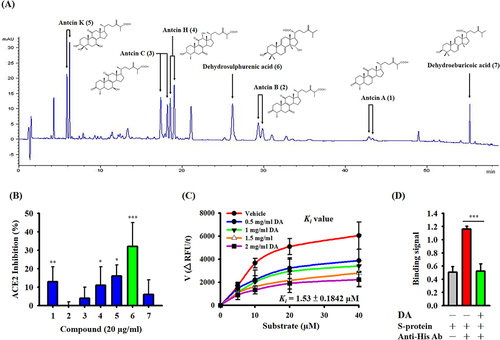
Figure 4 Effects of AC and DA on SARS-CoV-2 infection in a pseudovirus infection cell model. (A) Schematic diagram of the study design of SARS-CoV-2 pseudovirus infection. (B) The RLU values represent the levels of SARS-CoV-2 pseudovirus infection, and the data are expressed as the means ± SDs of the three separate experiments. *** indicates a significant difference at a level of p<0.001 compared to the control group.
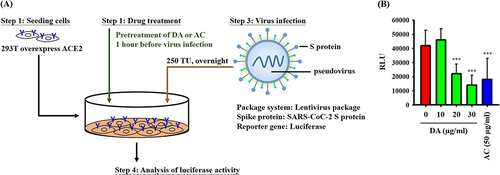
Figure 5 Effect of AC on the body weight and lung injury of SARS-CoV-2 delta-variant-infected hamsters. (A) Schematic diagram of the study design of the hamster model of SARS-CoV-2 delta-variant infection. (B) Effects of AC and remdesivir on body weight and lung injury in SARS-CoV-2 delta-variant-infected hamsters. (C) H&E staining (20 x magnification) of lung tissues from SARS-CoV-2 delta-variant-infected hamsters. (D) Comprehensive pathological scores of lung tissues from SARS-CoV-2 delta-variant-infected hamsters. The data in (B) and (D) are expressed as the means ± SDs. * and ** indicate significant differences at levels of p<0.05 and p<0.01, respectively, compared to H2O-treated hamster.
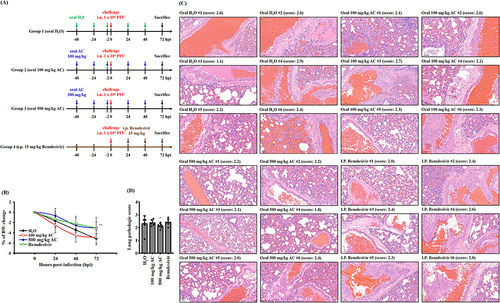
Figure 6 Effect of AC on IL-1β expression in vivo and in vitro. (A) IHC staining showing IL-1β protein expression in lung tissues from SARS-CoV-2 delta-variant-infected hamsters. The brown color represents IL-1β-positive cells. Original magnification, X400. (B) Effect of AC on ATP-mediated IL-1β secretion in LPS-primed macrophages. (C) Effect of AC on the LDH release in J774A.1 macrophages. The data are expressed as the means ± SDs of the three separate experiments. *, ** and *** indicate significant differences at levels of p<0.05, p<0.01 and p<0.001, respectively, compared to LPS+ATP-treated cells (B) or control cells (C).
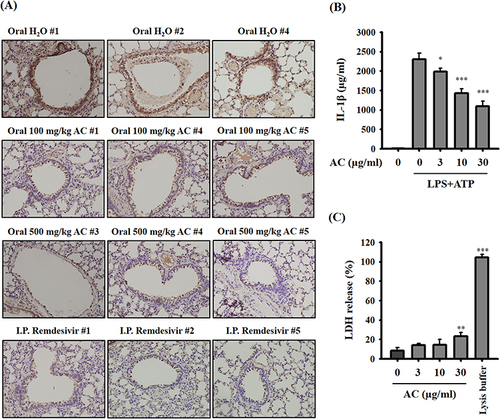
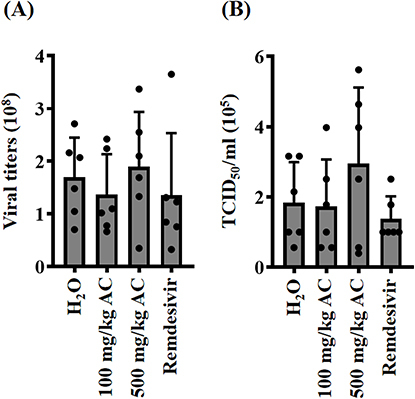
Figure 7 Effect of AC on viral replication in the lungs of SARS-CoV-2 delta-variant-infected hamsters. (A) Viral genomic RNA copy numbers in lung tissues. (B) Functional SARS-CoV-2 particle titers in the lungs are expressed as TCID50/mL.