Figures & data
Figure 1 Overall design and workflow of the study. Flow diagram for the analysis procedure used to explore the underlying role of METTL1 for this research.
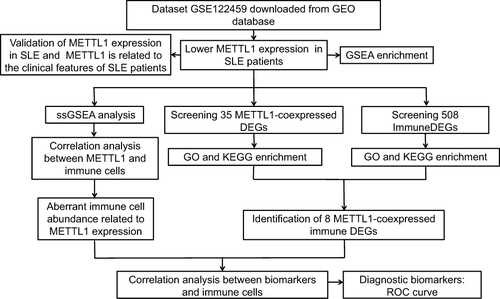
Figure 2 METTL1 was downregulated in SLE patient. (A) METTL1 mRNA expression between SLE (n=20) and HC (n=6) in GSE122459; (B) RT-qPCR for METTL1 mRNA expression in HC (n=18), SLE-AP (n=20) and SLE-SP (n=25); (C)Western blotting for METTL1 protein expression in HC (n=5) and SLE patients (n=8); (D) Quantitative analysis of METTL1 protein levels in HC (n=5), SLE-AP (n=5) and SLE-SP (n=3). Student’s unpaired two-tailed t test or Mann–Whitney test. Data are means ± SEM. *P < 0.05.
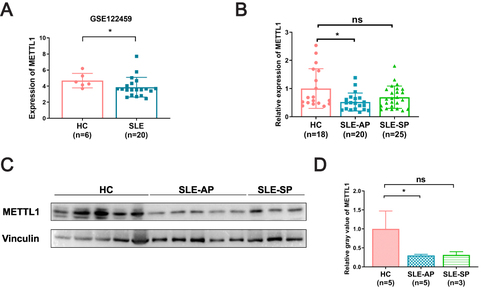
Table 1 Comparison of Clinical Characteristics Between SLE Patients with METTL1 Low and High Expression
Figure 3 Relationship between downregulation of METTL1 and clinical features in SLE. Correlation between METTL1 expression and age (A), C3 (B), C4 (C), IgM (D), IgA (E), IgG (F) (n=45), peripheral T lymphocyte (G), T helper cell (H), suppressor T cell (I), B lymphocyte (J) (n=12), NK cell (K) (n=10), and CD4/+CD8+ (L) (n=14). Pearson correlation test.
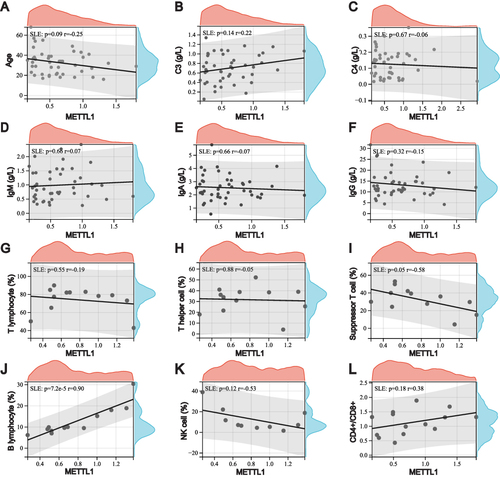
Figure 4 Exploration of METTL1-related function enrichment analysis. (A) GSEA enriched pathways in low METTL1 expression group; (B) Multiple GSEA enriched pathways in low METTL1 expression group; Volcano plot (C) for 35 METTL1-coexpressed DEGs; Bubble pot (D) and Circos plot (E) for the enrichment of METTL1-coexpressed DEGs.
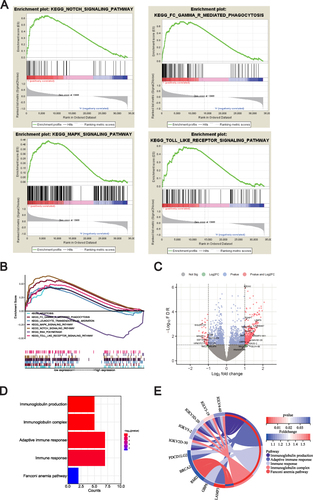
Figure 5 Correlation on of METTL1 with Immune cell infiltrates in SLE.Violin plot (A) for abundance of 28 infiltrating immune cell types in low and high METTL1 expression group; (B) Correlation analysis between METTL1 and infiltrating immune cells; (C) Correlation between METTL1 and activated CD4 T cell, activated CD8 T cell and memory B cell. Mann–Whitney test and Pearson correlation test.
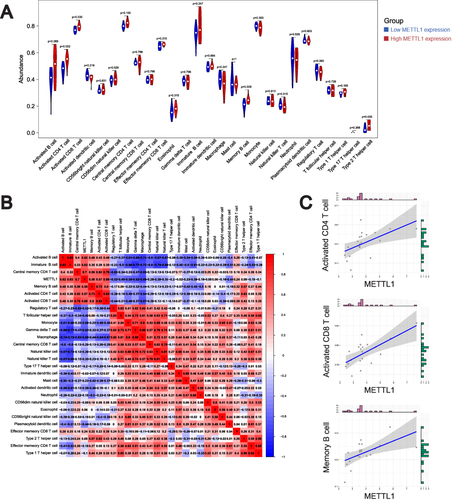
Figure 6 Intersection and validation of ImmuneDEGs co-expressed with METTL1. Bubble plot (A) and circos plot (B) for the GO enrichment analysis of ImmuneDEGs; Bubble plot (C) and circos plot (D) for the KEGG enrichment of ImmuneDEGs; Venn diagram (E) of 8 candidate genes overlapping ImmunDEGs and METTL1-coexpressed genes; Volcano plot (F) and Heatmap (G) and for 8 candidate genes between SLE and HC; Violin plot (H) for the expression of LAMP3, CD83 and PDCDILG2 in GSE50772 dataset for validation. Mann–Whitney test. Data are means ± SEM. *P < 0.05, ***P < 0.001.
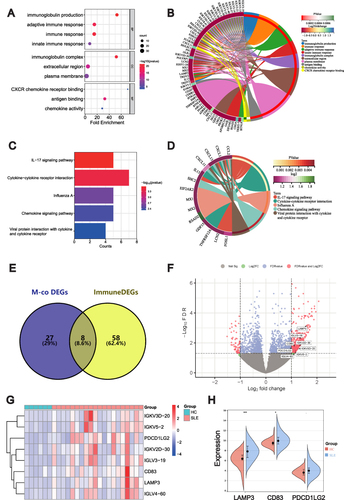
Figure 7 Correlation between METTL1-coexpressed ImmuneDEGs and differential expressed immune cells. Correlation between LAMP3 (A), CD83 (B), PDCD1LG2 (C), IGKV5-2 (D), IGKV3D-20 (E), IGLV4-60 (F), IGLV3-19 (G), IGKV2D-30 (H) and infiltrating immune cells. Pearson correlation test.
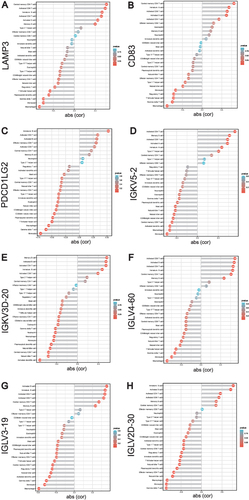
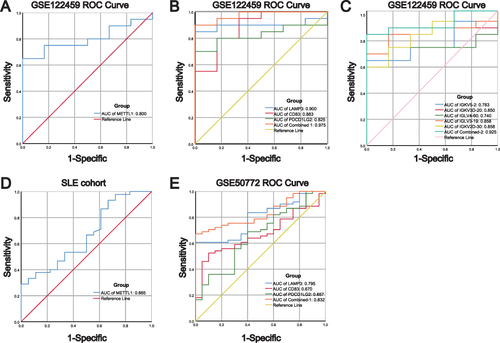
Figure 8 Diagnostic values of METTL1-coexpressed ImmuneDEGs in both discovery and validated cohorts. (A) ROC analysis for METTL1 in GSE122459; (B) ROC analysis for LAMP3, CD83, and PDCD1LG2 in GSE122459; (C) ROC analysis for IGKV5-2, IGKV3D-20, IGLV4-60, IGLV3-19, and IGKV2D-30 in GSE122459; (D) ROC analysis for METTL1 in our SLE cohort; (E) ROC analysis for LAMP3, CD83, and PDCD1LG2 in GSE50772.