Figures & data
Table 1 Clinical Characteristics of Recruited Individuals Among the Three Groups
Figure 1 The baseline serum concentrations of TAM receptor tyrosine kinases in AR patients. In comparison to the HC group, the serum levels of AXL (A), TYRO3 (B), and MER (C) were decreased in the AR group. Similarly, the circulating levels of AXL (D), TYRO3 (E), and MER (F) were considerably reduced in the MAR group as compared to the HC group, with the most significant decline observed in the MSAR subgroup. *P<0.05,**P<0.01,***P<0.001.
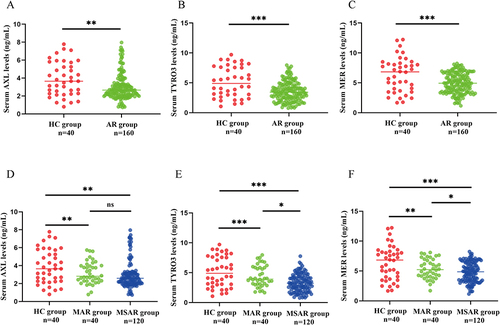
Figure 2 Correlation of baseline serum TAM receptor tyrosine kinases levels with disease severity in AR patients. Serum TYRO3 and MER levels showed a negative correlation with TNSS (A-C) and VAS (D-F) scores.
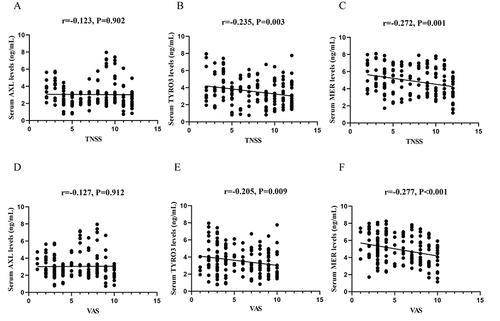
Figure 3 ROC curve analysis of serum AXL (A), TYRO3 (B), and MER (C) as biomarkers to reflect disease severity in AR patients.
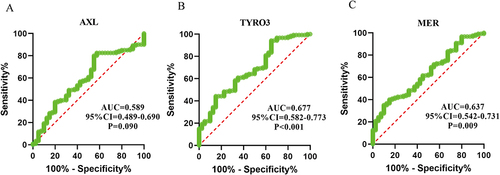
Table 2 Comparisons of Baseline Clinical Characteristics Between the Two Groups
Figure 4 Baseline serum levels of TAM receptor tyrosine kinases in the two groups and predictive values of early efficacy of SLIT. Serum AXL9 (A) levels were no significant difference between the two groups. Serum TYRO3 (B) and (C) MER expression levels were significantly decreased in the effective group than in the ineffective group. ROC demonstrated the ability of serum AXL (D), TYRO3 (E), and MER (F) to predict early efficacy in SLIT. *P<0.05,***P<0.001.
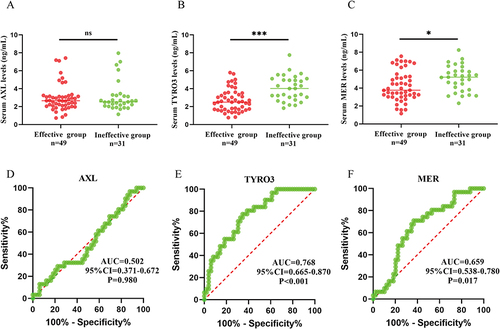
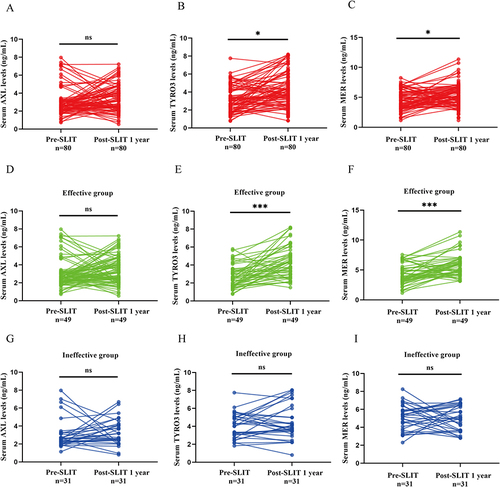
Figure 5 Serum TAM receptor tyrosine kinases concentrations in the effective and ineffective groups 1 year post-SLIT. Serum AXL (A) levels did not change significantly before and after treatment. Circulating TYRO3 (B) and MER (C) levels were increased after 1 year of SLIT than pre-SLIT levels. (D) In the effective group, serum AXL levels did not change significantly in pre-SLIT, but serum TYRO3 and MER (F) concentrations were significantly increased post-SLIT 1 year than pre-SLIT. Serum AXL, TYRO3, and MER levels were not significantly changed between post-SLIT 1 year and pre-SLIT (G–I). *P<0.05,***P<0.001.