Figures & data
Table 1 Baseline Clinical Data and Laboratory Indicators
Figure 1 Comparisons of NLR, MLR, PLR, and SIRI between GA patients and healthy controls. (A) MLR; (B) NLR; (C) PLR; (D) SII; (E) SIRI. ns, P > 0.05.
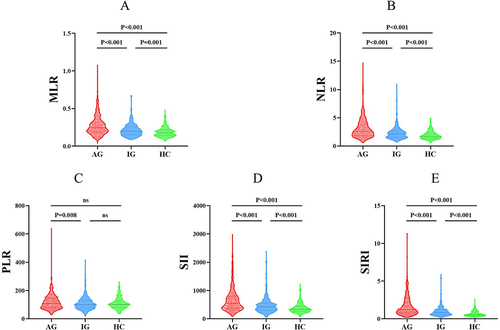
Table 2 Changes in MLR, NLR, PLR, SII, and SIRI Before and After Treatment in the AG and IG Groups
Figure 2 Changes in MLR, NLR, PLR, SII, and SIRI before and after treatment in the AG and IG groups. (A) ESR; (B) CRP; (C) MLR; (D) NLR; (E) PLR; (F) SII; (G) SIRI. ns, P > 0.05.
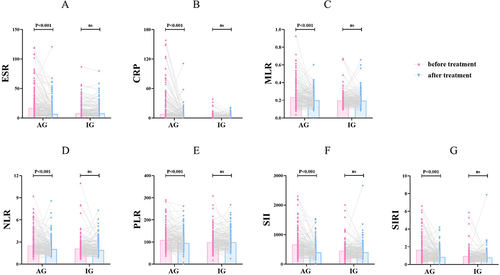
Table 3 Correlation Analysis of MLR, NLR, PLR, SII, and SIRI with Disease Activity Markers in Patients with Gouty Arthritis
Table 4 Multivariate Logistic Regression Analysis of Acute Gout Attack in Patients with Gouty Arthritis
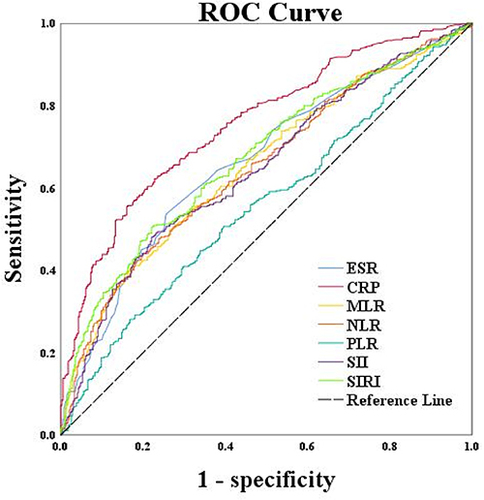
Table 5 Evaluation of the Diagnostic Efficacy of MLR, NLR, PLR, SII and SIRI for AG Using ROC Curves
Figure 3 Evaluation of the diagnostic efficacy of MLR, NLR, PLR, SII and SIRI for AG using ROC curves.