Figures & data
Table 1 Pairs of Forward-Reverse Primers
Figure 1 Study protocol. A flow chart of our study protocol.
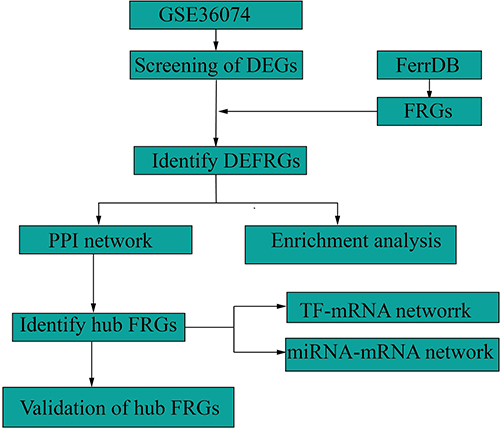
Figure 2 Ferroptosis-related differentially expressed genes in HF. (A) Volcano plot of differentially expressed genes. Significant upregulated genes are represented as red dots, Significant downregulated genes are represented as blue dots, and not differentially expressed genes are represented as blank dots. (B) Venn diagrams showing intersected genes overlapping between FRGs and DEGs. (C) The Heatmap of clustering analysis based on FRDEGs.
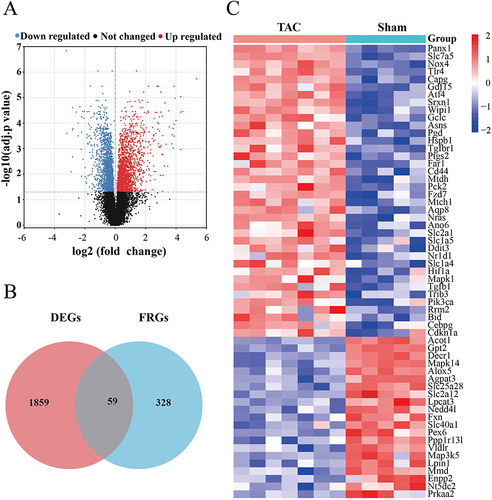
Figure 3 Functional enrichment analysis of FRDEGs. (A) GO enrichment of FRDEGs. (B) KEGG pathway analysis of FRDEGs. BP, biological processes; CC, cellular component. MF, molecular function.
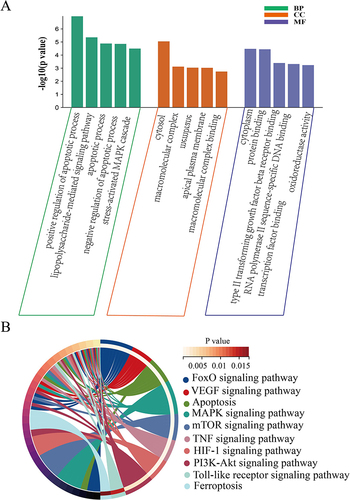
Figure 4 The screened key FRDEGs and predicted TFs. (A) Top five key FRDEGs screened by Degree method. (B) The TFs predicted for key FRDEGs.
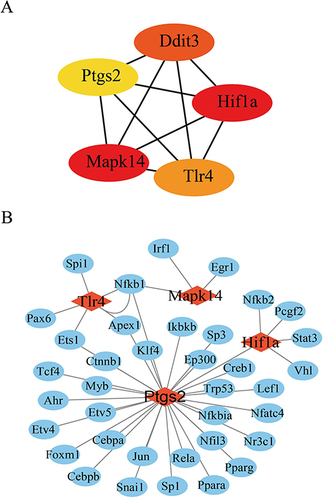
Figure 5 Construction of miRNA- FRDEGs regulatory network. miRNA- FRDEGs network construction.
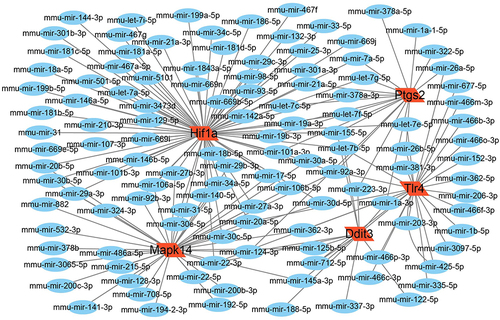
Figure 6 Established TAC-induced mouse model of HF. (A) Images of heart ultrasound; (B). LVEF: left ventricular ejection fraction; (C). LVFS: left ventricular fractional shortening; (D). LVIDs: left ventricular internal diameter at end-systole; (E). LVIDd: left ventricular internal diameter at end-diastole. Values are expressed as mean (± SD) (n=5); **p < 0.01 and ***P < 0.001 vs Sham group.
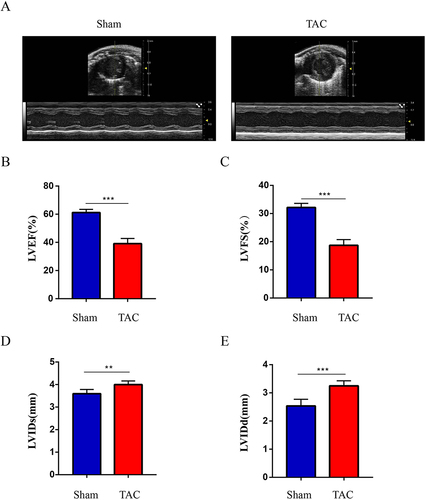
Figure 7 Validation of key FRDEGs expression at the mRNA levels. Mapk14, Hif1a, Ddit3, Tlr4 and Ptgs2 mRNA level in the TAC and sham groups in mice. Expression levels were standardized for GAPDH levels. Values are expressed as means (± SD) (n = 4), *p < 0.05; **p < 0.01 and ***p < 0.001vs Sham group.
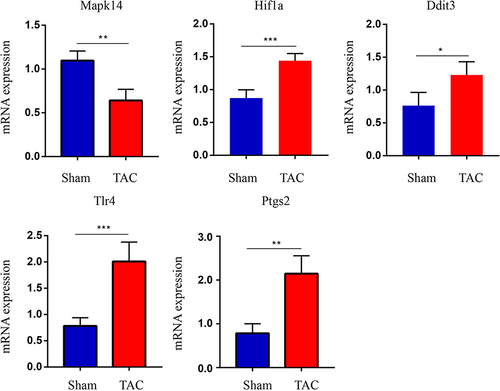
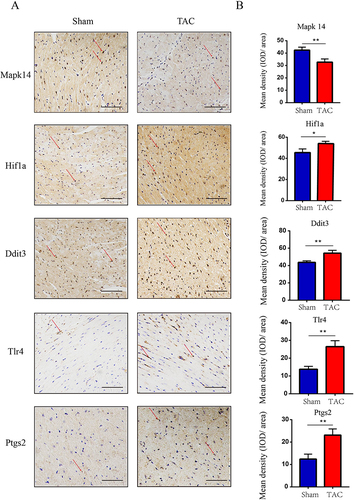
Figure 8 Validation of key FRDEGs expression at protein levels. (A) IHC staining of Mapk14, Hif1a, Ddit3, Tlr4 and Ptgs2 proteins in the TAC and sham groups. (B) Quantitative analysis of Mapk14, Hif1a, Ddit3, Tlr4 and Ptgs2 proteins in the TAC and sham groups. The red arrows represent positive cells. Values are expressed as means (± SD) (n = 3). *p < 0.05 and **p < 0.01 vs Sham group; Original magnification, ×200. Scale bar: 100 μm.