Figures & data
Table 1 Characteristics of Study Participants According to SII Quartiles
Table 2 The Relationships between SII and DPN-Related Risk Factors
Table 3 Univariate and Multivariate Logistic Analysis of Factors Associated with DPN
Table 4 Adjusted ORs and 95% CIs for DPN According to SII Quartiles
Table 5 Stratified Analyses of SII and Risk of Prevalence of DPN by Sex, Age, BMI, Duration of Diabetes, Hypertension, Dyslipidaemia, Poor Glycaemic Control, and eGFR
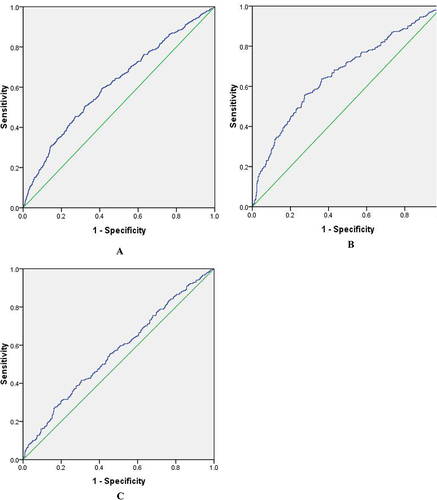
Figure 1 (A) ROC analysis of SII to indicate DPN for all subjects. AUC = 0.614; 95% CI: 0.584–0.641; P <0.05; identified SII cutoff value = 617.67; Youden index = 0.183; sensitivity: 45.3%; specificity: 73%. (B) ROC analysis of SII to indicate DPN for male subjects. AUC = 0.662; 95% CI: 0.621–0.703; P <0.05; identified SII cutoff value = 557.25; Youden index = 0.282; sensitivity: 55.8%; specificity: 72.4%. (C) ROC analysis of SII to indicate DPN for female subjects. AUC = 0.564; 95% CI: 0.522–0.606; P <0.05; identified SII cutoff value = 617.67; Youden index = 0.111; sensitivity: 41.6%; specificity: 69.5%.