Figures & data
Table 1 Baseline Patient Demographics and Characteristics
Figure 1 (A) Effects of different levels of age, ICU stay, APACHE II, HbA1c, GV and GLUave on mortality in patients with sepsis secondary PICS. (B) Effects of different levels of IL-6, IL-8, IL-10, 1d LYM, 14d LYM, 14dALB and 1d HDL-C on mortality in patients with sepsis secondary PICS. **P<0.01, *P<0.05.
Abbreviations: APACHE II, acute physiology and chronic health evaluation II; HbA1c, glycated hemoglobin; GV, glycemic variability; GLUave, glucose average; IL-6, interleukin-6; IL-8, interleukin-8; IL-10, interleukin-10; LYM, lymphocyte; ALB, albumin; HDL-C, high density lipid-cholesterol.
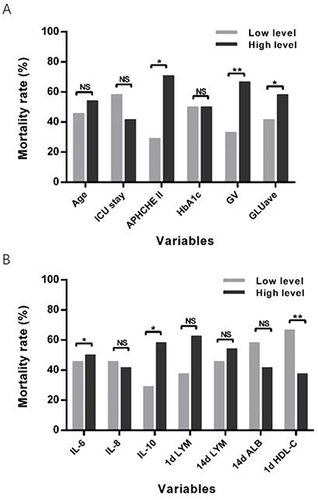
Table 2 Characteristic Analysis of Patients Receiving Insulin Therapy
Table 3 Binary Logistic Regression Analysis of Secondary PICS Risk Factors in Patients with Sepsis
Table 4 ROC Curve Parameter
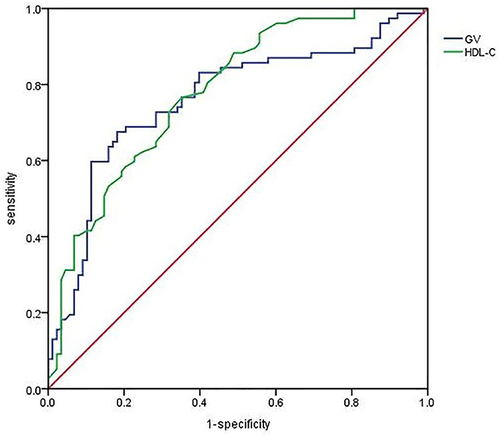
Figure 2 ROC curve of the predictive value of GV and HDL-C for secondary PICS in sepsis patients.
Abbreviations: GV, glycemic variability; HDL-C, high density lipid-cholesterol.