Figures & data
Figure 1 The overall flow chart of this study.
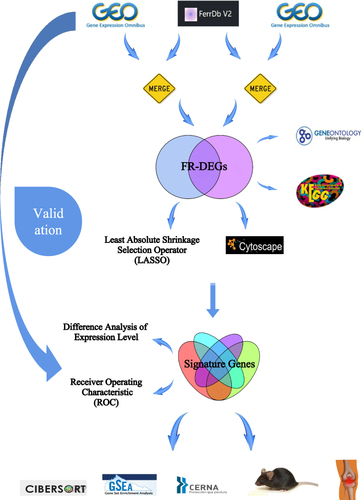
Table 1 OA-Related Dataset from the GEO Database
Figure 2 Identification of FR-DEGs. (A and B) The volcano plot of differentially expressed genes(DEGs) in GSE11407 and GSE55235. (C and D) Venn diagram showing the overlap of genes between DEGs and ferroptosis-related genes in FerrDb database. (E) Venn diagram showing the overlap of co-expressed ferroptosis genes between GSE11407 and GSE55235. (F and G) Clustered heatmap of ferroptosis-related DEGs (FR-DEGs) in GSE11407 and GSE55235.
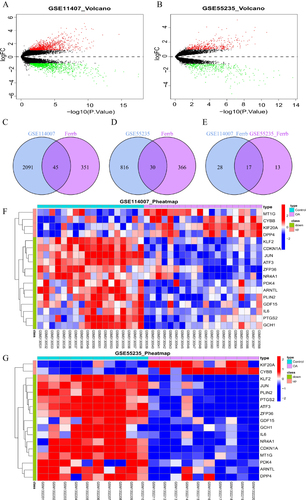
Figure 3 Correlation analysis and functional enrichment analysis of FR-DGEs. (A and B) Correlation heatmap of 17 FR-DEGs in GSE114007 and GSE55235,*P<0.05,**P<0.01,***P<0.001. (C) GO enrichment analysis. (D and E) KEGG enrichment analysis.BP:biological process;CC:biological process;MF:molecular function.
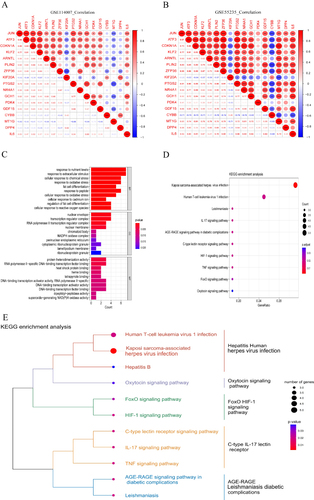
Figure 4 Construction of the PPI network.(A and B) PPI network for 17 FR-DEGs constructed by Cytoscape, isolated nodes were removed.(C)Module genes identified by MCODE plugin. (D)The top 10 core target genes identified based on the MCC algorithm in cytohubba plugin. Proteins are represented by nodes, and protein interactions are represented by edges. Node color indicates gene expression, with Orange for up-regulated and green for down-regulated expression. Node size corresponds to the degree value, with larger nodes indicating higher degrees.
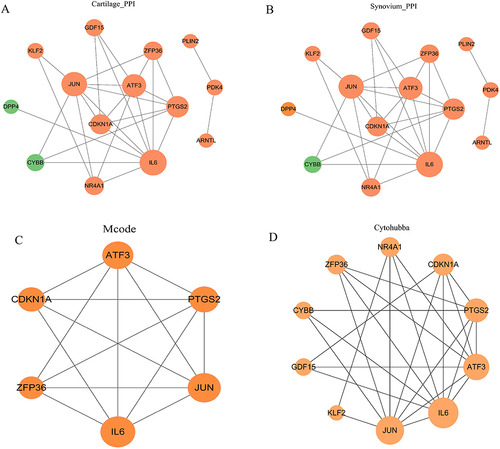
Figure 5 Identification of characterized genes. (A and B) LASSO logistic regression algorithm of FR-DEGs in GSE114007 and GSE55235.(C)The intersection of LASSO, MCODE and cytohubba.
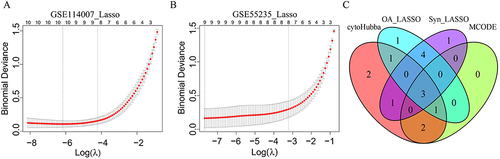
Figure 6 Differential expression analysis of the characterized genes. Different expression of JUN, ATF3, and CDKN1A in OA and Control samples in the (A and B) train set and (C-E) external verification set.
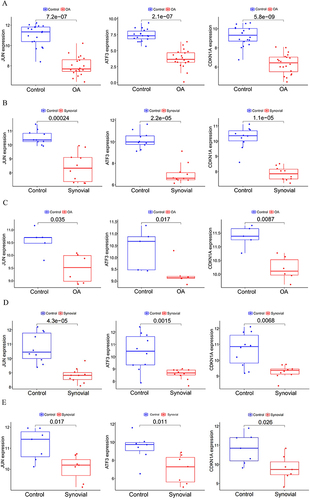
Figure 7 Validation of the characterized genes. The ROC curve and the diagnostic prediction model of JUN, ATF3, and CDKN1A in the (A and B) train set and (C-E) external verification set.
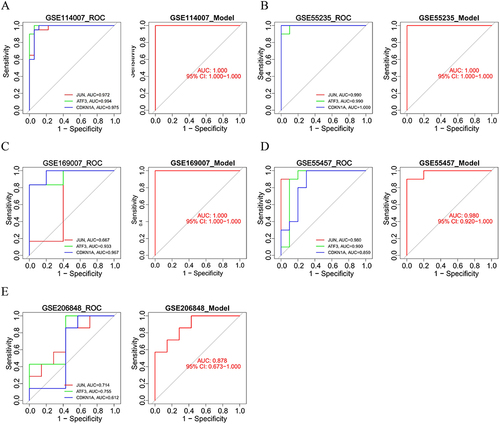
Figure 8 Immune infiltration analysis and correlation of the signature genes with immune cells. (A and B) Differential analysis of the 22 immune cells between the articular cartilage and synovial membrane of patients with OA and normal individuals in GSE11407 and GSE55235. (C and D) Correlation analysis between the signature genes and immune cells, red represents positive correlation and blue represents negative correlation,*P<0.05,**P<0.01,***P<0.001.
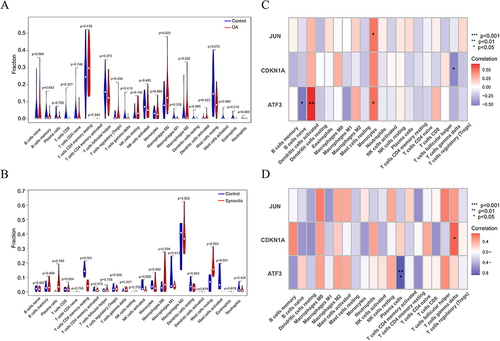
Figure 9 GSEA results showed that the signature genes in cartilage (A) were mainly enriched in cell adhesion molecules, cytokine receptor interaction and systemic lupus erythematosus.The featured genes in synovium (B) were enriched for amino acid metabolism, citric acid cycle, pantothenate and coenzyme a biosynthesis, and P53 signaling pathway. The top six enriched signaling pathways of the featured genes are shown in the panel (A and B).
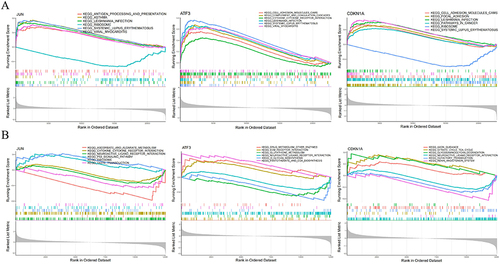
Figure 10 Construction of the feature genes ceRNA network.The network comprises eigengenes, their corresponding miRNAs, and lncRNAs.The red oval represents three important miRNAs: hsa-miR-1972, hsa-miR-665, and hsa-miR-181a-2-3p, the red square represents two significant lncRNAs: FAM95B1 and RP5-894D12.5. Diamond, Orange: signature gene; oval, green: miRNA; square, blue: lncRNA.
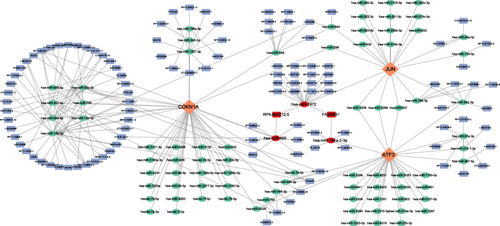
Figure 11 H&E staining shows that compared with the control group, the knee joint cartilage of mice in the OA group showed significant cartilage degradation(A). Mankin score in OA group was higher than that in control group(B). The results of Western blot (C) and qRT-PCR (D and E) showed that the expression levels of JUN, ATF3, CDKN1A and GPX4 in the articular cartilage and synovial membrane of OA mice were lower than those in the normal group, *P<0.05, ***P<0.001.
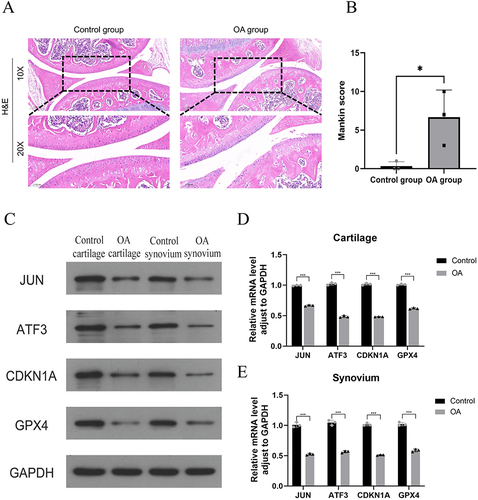
Figure 12 Immunohistochemistry results indicated that the expressions of JUN, ATF3 and CDKN1A were down-regulated in the OA group compared to the control mice. (A)Representative immunohistochemistry images of JUN, ATF3 and CDKN1A in the control and OA groups. (B and C) Quantitative analysis, *P<0.05, **P<0.01.
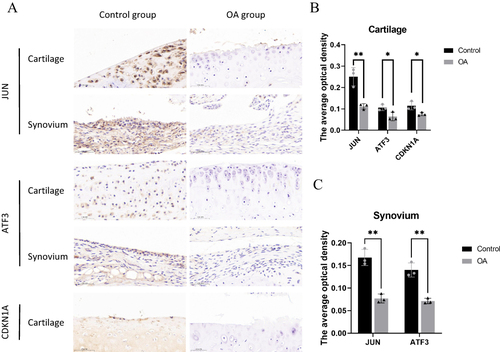
Figure 13 The qRT-PCR results showed that the expression levels of IL-1β and TNF-α in the articular cartilage and synovium of OA patients were higher than those in the normal group(A). The results of biochemical testing (B) and qRT-PCR (C) showed that the GSH content in the articular cartilage and synovium of patients with OA was decreased, while the ferrous ion content increased, as compared to the control group.The expression levels of JUN, ATF3, CDKN1A, and GPX4 were reduced,**P<0.01, ***P<0.001.
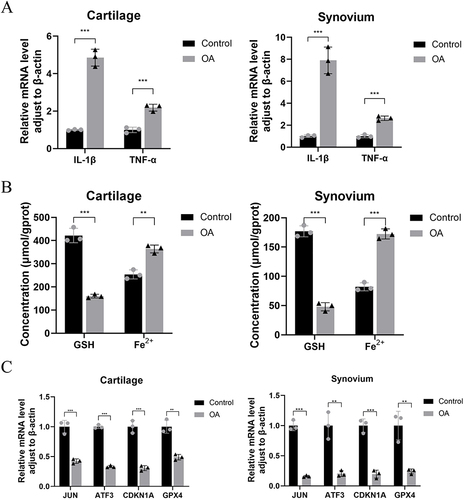
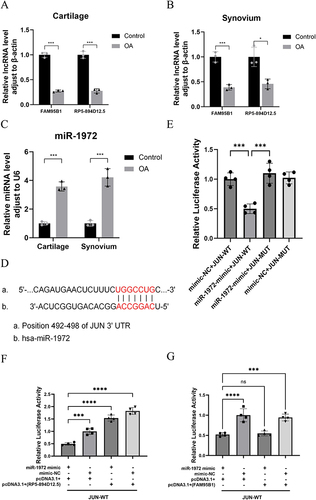
Figure 14 A ceRNA network regulatory mechanism exists between RP5-894D12.5, miR-1972, and JUN. The qRT-PCR results showed that compared with the control group, there were differences in the expression of FAM95B1, RP5-894D12.5 (A and B), and miR-1972 (C) in the cartilage and synovium of clinical OA patients. (D) Predicted interaction site between JUN and miR-1972. (E) The relative luciferase activity in 293T cells after co-transfection of miR-1972 mimic, mimic NC with JUN-WT and JUN-MUT was measured. (F and G) The relative luciferase activity in 293T cells after co-transfection of JUN-WT and MUT plasmids with miR-1972 mimics, mimic NC, overexpression vectors (RP5-894D12.5, FAM95B1) or empty vector pcDNA3.1 (+) was measured. *P<0.05, ***P<0.001, ****P<0.0001.