Figures & data
Figure 1 Effects of Mast-M on THP-1 macrophage cytotoxicity and apoptosis. (A) Mast-M structure. (B) in vitro experiment protocol. (C) in vivo experiment protocol. (D) cell viability assay of THP-1 macrophage. (E and F) THP-1 macrophages were treated with Mast-M (0.1–20μg/mL) for 10h. The Protein levels of C-CASP3 and CASP3 were analyzed by Western blot. Data were expressed as mean ± SEM (n=3). *p<0.05 vs Control group.
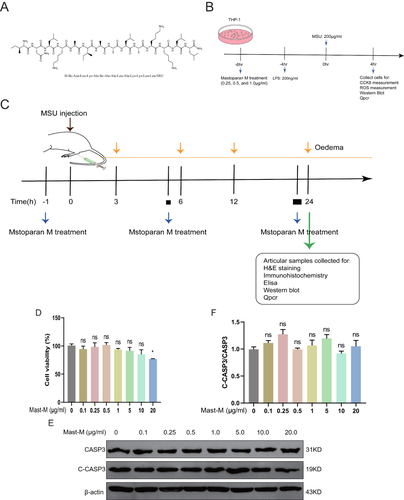
Table 1 Primer Sequences
Figure 2 Mast-M inhibits NLRP3 inflammasome activation in THP-1 macrophages stimulated by LPS plus MSU. (A) The protein expression of IL-1β was evaluated by Western blot of macrophages treated with different treatments LPS (200ng/mL) alone for 8h, MSU (200μg/mL) alone for 8h, LPS (200ng/mL) first for 4h and MSU (200μg/mL for 4h). THP-1 macrophages were pre-treated with Mast-M for 2 hours, followed by separate inductions using LPS and MSU. QPCR determination of the mRNA expression of (B) NLRP3, (C) Caspase-1, (D) ASC, and (E) IL-1β. (F and G) The expression of NLRP3 inflammasome was determined by Western blot. Data were expressed as mean ± SEM (n=3). #p<0.05, ##p<0.01, ###p<0.001 vs Control group; *p<0.05, **p<0.01, ***p<0.001 vs LPS plus MSU group.
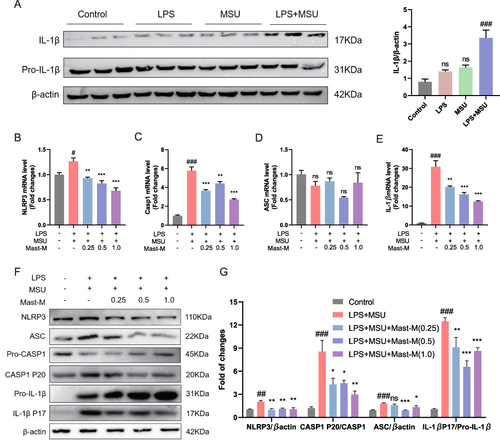
Figure 3 Mast-M inhibits MAPKs and NF-κB pathways in THP-1 macrophages stimulated by LPS plus MSU. THP-1 macrophages were pre-treated with Mast-M for 2 hours, followed by separate inductions using LPS and MSU. (A and B) The expression of P38, P-P38, JNK, P-JNK, ERK, and P-ERK were determined by Western blot. (C and D) The expression of P65, P-P65, IKK, P-IKK, IκB, and P-IκB were determined by Western blot. (E and F) The expression of COX-2 and TNF-α was determined by Western blot. Data were expressed as mean ± SEM (n=3). #p<0.05, ##p<0.01, ###p<0.001 vs Control group; *p<0.05, **p<0.01, ***p<0.001 vs LPS plus MSU group.
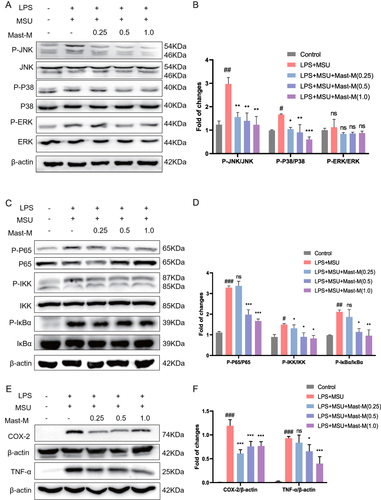
Figure 4 Mast-M inhibits oxidative stress production in THP-1 macrophages stimulated by LPS plus MSU. (A and B) ROS is detected by DCFH-DA fluorescent probe in macrophages pretreated with Mast-M for 2 h and then incubated with LPS plus MSU. (C and D) The protein levels of Nrf2, HO-1, and SOD2 were evaluated by Western blot in macrophages pretreated with Mast-M for 2 h and then incubated with LPS plus MSU. Data were expressed as mean ± SEM (n=3). #p<0.05, ###p<0.001 vs Control group; *p<0.05, **p<0.01, ***p<0.001 vs LPS plus MSU group.
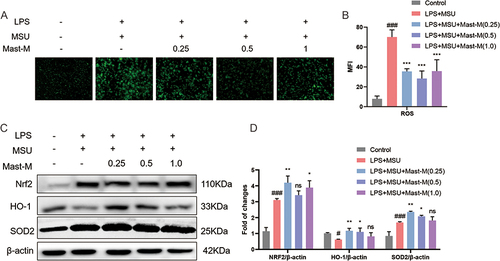
Figure 5 Mast-M alleviates MSU-induced gouty arthritis in C57BL/6 mice. (A and B) Foot paw thickness changes were measured at different times after MSU injection. (C) Edema tissue IL-1β content was detected. (D) After MSU injection for 24h, the foot paws were taken pictures and subjected to HE staining, the F4/80 and LY6G were analyzed by immunochemical staining. (E–G) Densitometric analysis was used to quantify the levels of HE staining, F4/80, and LY6G. Data were expressed as mean ± SEM (n=5). #p<0.05, ###p<0.001 vs Control group; **p<0.01, ***p<0.001 vs MSU group.
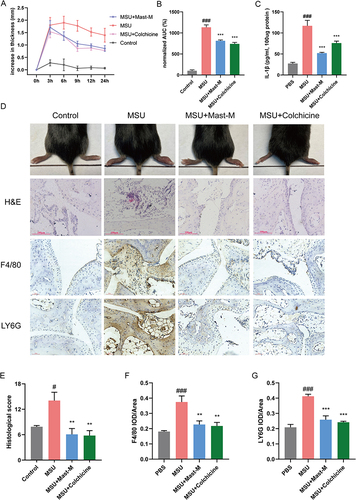
Figure 6 Mast-M inhibits NLRP3 inflammasome activation in a mouse model of gout. QPCR analysis of (A) NLRP3, (B) Caspase 1, (C) ASC, and (D) IL-1β in the homogenate of paw tissue from mice. (E and F) Western blot analysis of NLRP3, pro-Caspase 1, Caspase 1 P20, ASC, pro-IL-1β, and IL-1β in the homogenate of paw tissue from mice. Data were expressed as mean ± SEM (n=3). #p<0.05, ##p<0.01, ###p<0.001 vs Control group; *p<0.05, **p<0.01, ***p<0.001 vs MSU group.
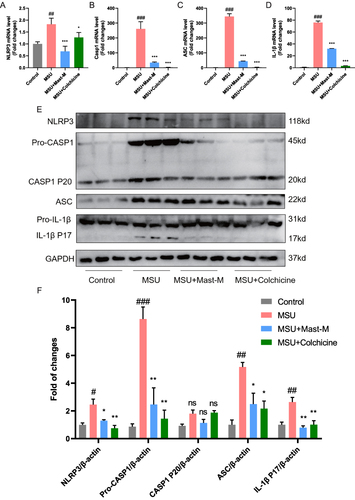
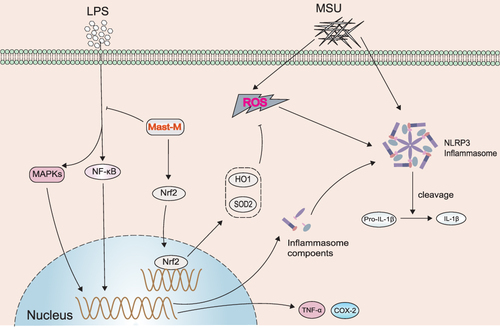
Figure 7 Schematic diagram showing the effect of Mast-M on LPS plus MSU-stimulated NLRP3 inflammasome activation in macrophages.