Figures & data
Table 1 Basic Clinicopathologic Characteristics of Cervical Cancer
Table 2 Univariate and Multivariate Logistic Analysis Among Clinicopathologic Parameters, Systemic Inflammatory Markers, and Sarcopenia
Table 3 Univariate and Multivariate Logistic Analysis Among Clinicopathologic Parameters, Systemic Inflammatory Markers, and SAI
Table 4 Univariate and Multivariate Logistic Analysis Among Clinicopathologic Parameters, Systemic Inflammatory Markers, and VAI
Table 5 Univariate and Multivariate Logistic Analysis Among Clinicopathologic Parameters, Systemic Inflammatory Markers, and IMAI
Table 6 Univariable and Multivariable Cox Analyses Associated with Overall Survival
Figure 1 Kaplan-Meier plot of association between body composition combined with inflammation markers and OS. (A) LMR + Sarcopenia. (B) NLR + Sarcopenia. (C) SII + VAI. (D) SII + IMAI. (E) LMR + SAI.
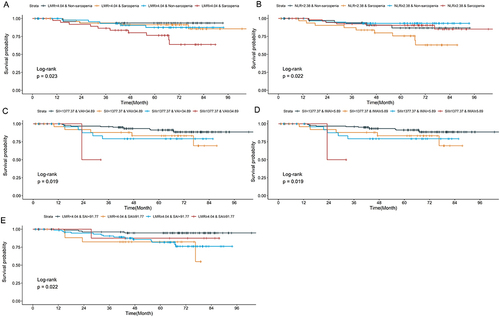
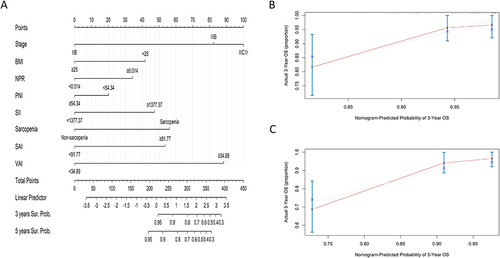
Figure 2 Nomogram for predicting survival. (A) Nomogram to predict the 3-year and 5-year overall survival rates of LACC patients. Calibration plot of the nomogram for the (B) 3-year and (C) 5-year survival rates.