
Figures & data
Figure 1 Flowchart of the study cohort.
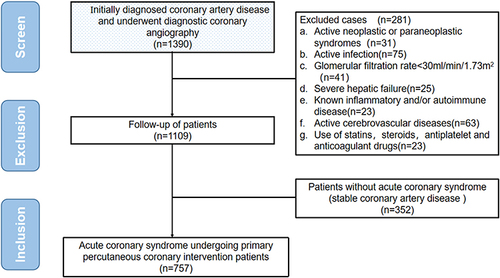
Table 1 Baseline Characteristics of 757 Patients with Initially Diagnosed Acute Coronary Syndrome
Table 2 Receiver Operating Characteristic Curve Analysis
Figure 2 Receiver operating characteristic (ROC) curve analysis with the area under the curve of SII, NLR, PLR. MLR and FAR in predicting.
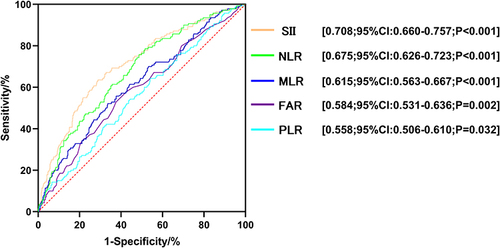
Table 3 Clinical Outcomes in Initially Diagnosed Acute Coronary Syndrome Patients According to SII Score
Figure 3 Kaplan-Meier survival curve analysis showing: (A) MACEs, (B) cardiac death, (C) non-fatal myocardial infarction, (D) non-fatal stroke, (E) rehospitalization for congestive heart failure, (F) Revascularization.
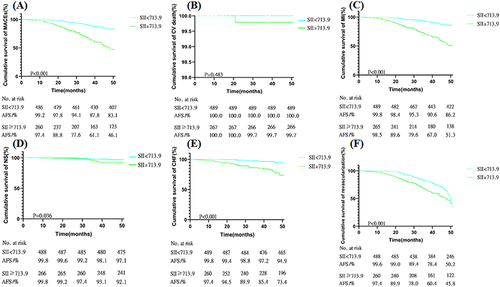
Table 4 Cox Regression Analysis
Table 5 The Association of High SII (≥713.9*109/L) and Future Adverse Events in Initially Diagnosed Acute Coronary Syndrome Patients
Figure 4 Subgroup analysis of the predictive value of high SII vs low SII for MACEs in initially diagnosed acute coronary syndrome patients.
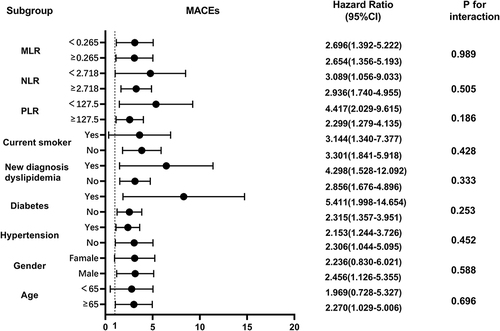
Table 6 Evaluation of Predictive Models for Cardiovascular Events