Figures & data
Figure 1 Prognostic evaluation of distinct subcategories within IRGPI. (A) Univariate analysis based on Cox proportional hazards of the 13 immune-related hub genes. (B and C) Kaplan-Meier survival analysis for the TCGA and GEO cohorts individually (with a significance level of P <0.05). (D and E) Assessment of the AUC for the IRGPI subcategories within the TCGA and GEO cohorts, respectively. (F and G) Independent univariate and multivariate Cox regression analyses encompassing clinicopathological variables and the IRGPI score, respectively (with asignificance level of P<0.05).
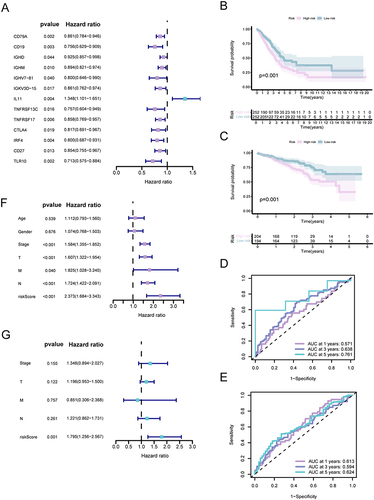
Figure 2 Molecular characteristics of different IRGPI subgroups. (A and B) Sets of genes exhibiting enrichment within the high- and low-risk subcategories, respectively (P <0.05). (C and D) Remarkably altered genes in samples of mutated LUAD across distinct IRGPI subgroups. The genes with mutations (top 20, represented as rows) are sorted based on mutation rates; the samples (columns) are arranged to emphasize the exclusiveness of mutations. The right side demonstrates the proportion of mutations, while the top depicts the overall count of mutations. The color scheme provides insight into the type of mutation.
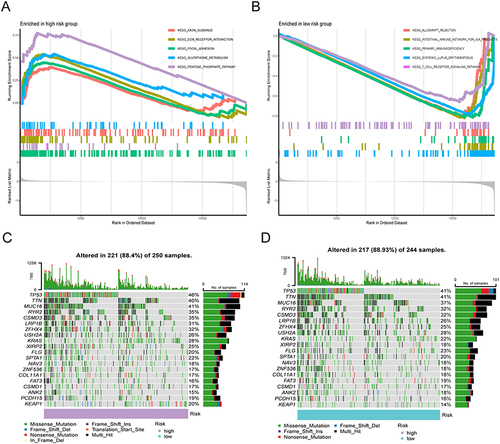
Figure 3 The TME panorama in LUAD and the attributes of distinct IRGPI subcategories. (A) The distribution of TME cells across various IRGPI subgroups using the CIBERSORT approach. The scattered data points depict the immune scores of the two subgroups. Bold lines indicate the median value. The lower and upper extremes of the boxes represent the 25th and 75th percentiles (interquartile ranges), respectively. Noteworthy statistical disparities between the two subgroups were evaluated via the Wilcoxon test (* P <0.05; ** P <0.01; *** P <0.001). (B-C) The IRGPI classification and proportions of TME cells for 346 patients within the TCGA cohort. Patient annotations encompass age, tumor stage, gender, T, M, N, and tumor stage. (D) Visualization of immune cell patterns for diverse IRGPI subgroups across multiple platforms.
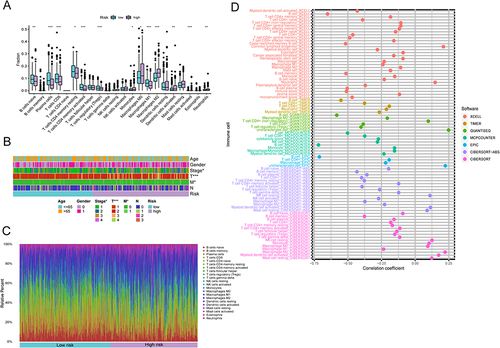
Figure 4 Dispersion of immune and molecular categories and the immunological reaction to ICI treatment within distinct IRGPI subcategories. (A) a Heat map and tabulation of LUAD immune categories across the various IRGPI subgroups. (B) Heat map and tabulation of LUAD immune categories across the diverse IRGPI subgroups. The contrasting immune classifications within the IRGPI subgroups were examined through 2 tests.
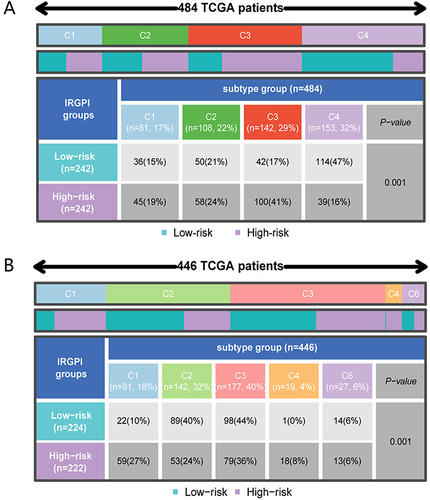
Figure 5 The predictive significance of IRGPI in patients subjected to anti-PD-L1 therapy. (A) Assessment of TIDE, MSI, T-cell exclusion, and dysfunction scores in diverse IRGPI subcategories (Wilcoxon tests, *, P < 0.05; **, P < 0.01; ***, P < 0.001). (B) Kaplan-Meier survival analysis of the IRGPI subcategories in a urothelial carcinoma cohort. (C) Receiver Operating Characteristic (ROC) analysis of IRGPI for OS at 6, 12, and 18 months follow-up in a urothelial carcinoma cohort.
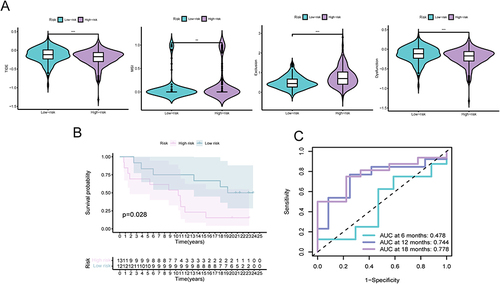
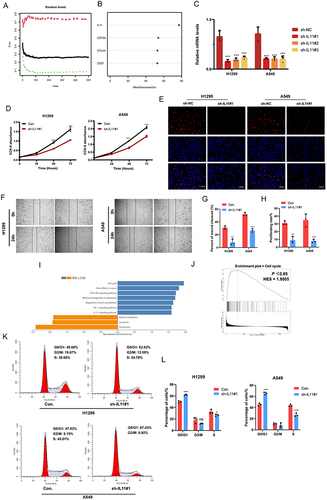
Figure 6 IL11 promotes the malignant biological characteristics of LUAD cells. (A) Utilizing the random forest tree algorithm, IRGPI genes are computed. The x-axis portrays the count of decision trees, while the y-axis signifies the error rate. (B) Findings from the RF algorithm employing the Gini coefficient method. (C) Validation of IL11 knockdown in H1299 and A549 cells verified by RT-PCR. (D–H) The influence of transient sh-IL11 on cell proliferation and migration assessed through CCK-8, colony formation, and wound healing assays. (I and J) GSEA analysis exhibits IL11-related KEGG pathways in the TCGA-LUAD cohort. (K and L) Examination of cell cycle progression in transiently transfected H1299 and A549 cells through flow cytometry using PI staining. The data reflects the mean ± SD of three separate experiments; ns: not statistically significant; *P < 0.05; **P < 0.01; ***P < 0.001. Bar =50μm.