
Figures & data
Figure 1 Differentially expressed genes (DEGs) in septic acute kidney injury (S-AKI). (A and B) Principal component analysis (PCA) before and after elimination of batch effects. (C and D) Gene expression level statistics of the dataset before and after homogenization. (E) Volcano map showing DEGs between S-AKI and control. (F) Heatmap showing DEGs between S-AKI and control.
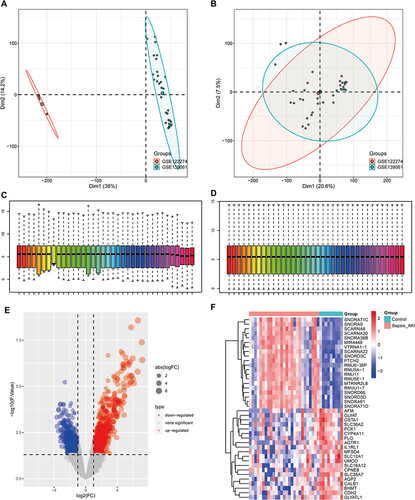
Figure 2 Enrichment analysis in DEGs. (A–C) GO annotations, which include BP, CC, and MF. (D) KEGG.
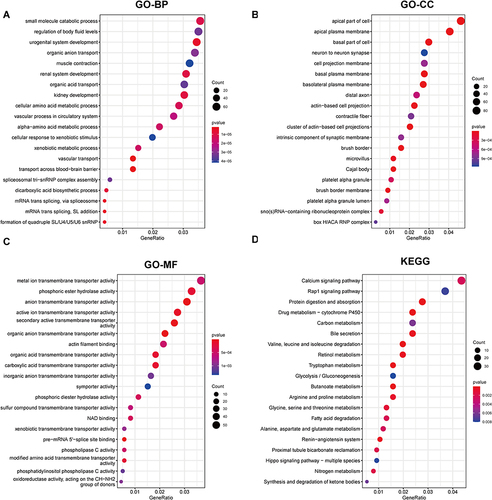
Figure 3 Glycosylation-related DEGs (GRDEGs) in S-AKI. (A and B) Volcano and heat map of GRDEGs in S-AKI. (C) The expression of 45 GRDEGs in S-AKI. *p<0.05, **p<0.01, ***p<0.001.
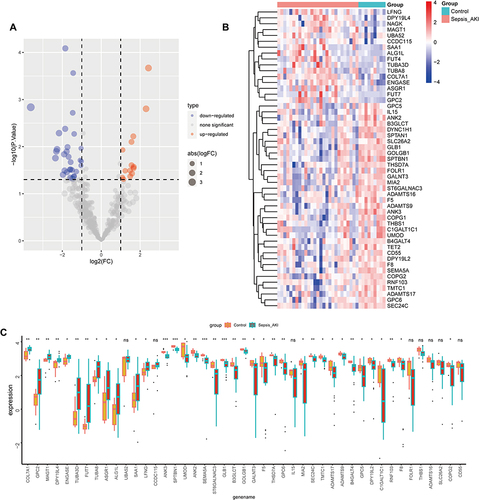
Figure 4 Enrichment analysis of GRDEGs. (A) Venn diagram of glycosylation-related genes and upregulated DEGs. (B) Venn diagram of glycosylation-related genes and downregulated DEGs. (C) The GO annotation of GRDEGs. (D) The KEGG analysis of GRDEGs. (E) The correlation between the top 5 KEGG pathway with GRDEGs.
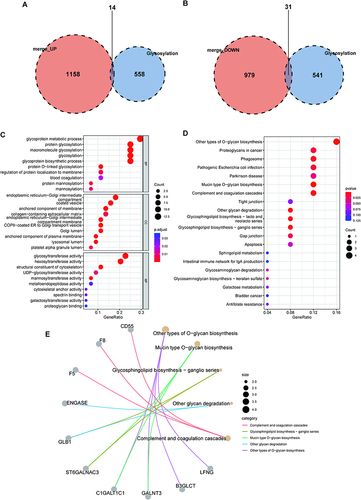
Figure 5 Hub genes selection based on machine learning algorithms. (A) LASSO regression screened for 11 genes. (B) Random forest screened for 15 genes. (C) SVM screened for 45 genes. (D) Venn diagram showing the hub genes shared by LASSO, random forest, and SVM-RFE algorithms. (E) The correlation between the 7 hub genes. (F) ROC curve of 7 gene signatures in S-AKI diagnosis.
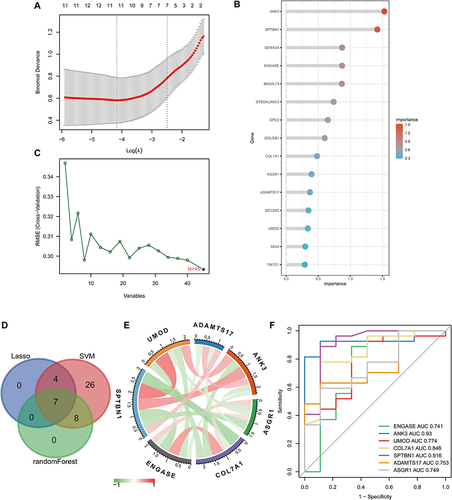
Figure 6 The characteristics of immune cell infiltration between the S-AKI and control groups. (A) Demonstrate the correlation of immune cell infiltration in S-AKI. (B) Differences in immune cell infiltration between the S-AKI and control groups. *p<0.05, ***p<0.001. (C) The correlation of 7 hub genes with immune cell infiltration.
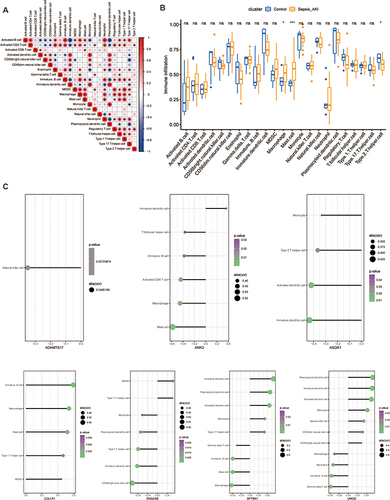
Figure 7 The heat map of correlation analysis related hub genes.
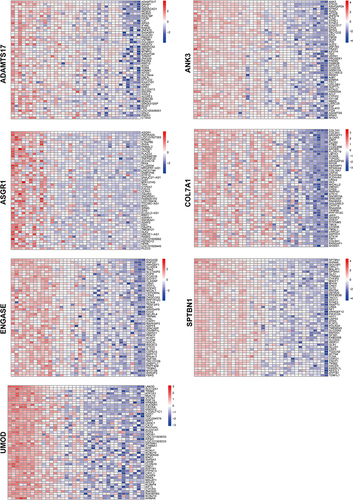
Figure 8 The Gene Set Enrichment Analysis (GSEA) of hub genes in S-AKI.
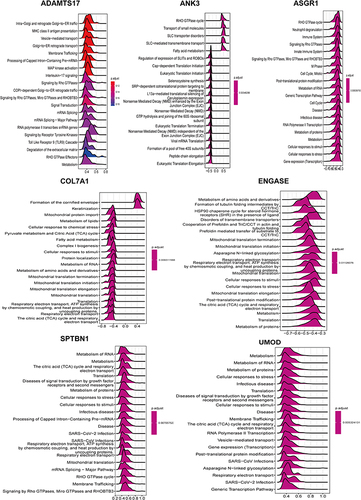
Figure 9 The miRNAs-mRNA and TFs-mRNA network diagram.
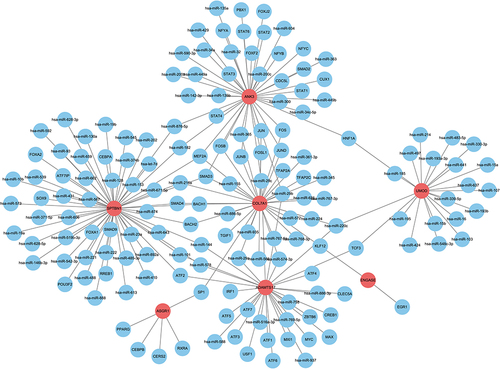
Figure 10 Gene-compound network diagram.
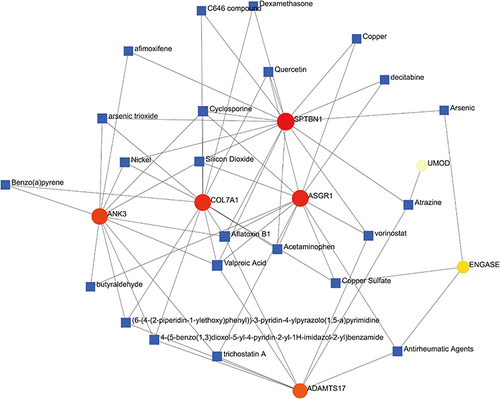
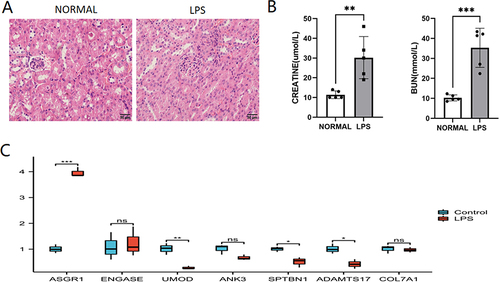
Figure 11 The validation of GRDEGs in animal experiments. (A) HE staining of S-AKI. Scale bar: 50um. (B) BUN and creatinine levels in mouse normal and LPS groups. (C) qRT-PCR analysis of the hub genes. Student’s t-test. Data shown mean ± SEM, n = 5. *P<0.05; **P<0.01;***P<0.005.
Data Sharing Statement
Data, including GSE122274 and GSE139061, were downloaded from the NCBI for Biotechnology Information Gene Expression Omnibus database (GEO, http://www.ncbi.nlm.nih.gov/geo).