Figures & data
Table 1 Primer Sequences Used
Figure 1 Immune microenvironment of airway tissues in healthy controls and COPD patients. (A) Relative proportions of infiltrating immune cells in GSE20257. (B) Relative proportions of infiltrating immune cells in GSE10006. (C) Differences of immune cells composition between healthy controls and COPD patients in GSE20257. (D) Differences of immune cells composition between healthy controls and COPD patients in GSE10006. Blue represents healthy controls; red represents COPD patients. ns, no significance; *P < 0.05, **P < 0.01.
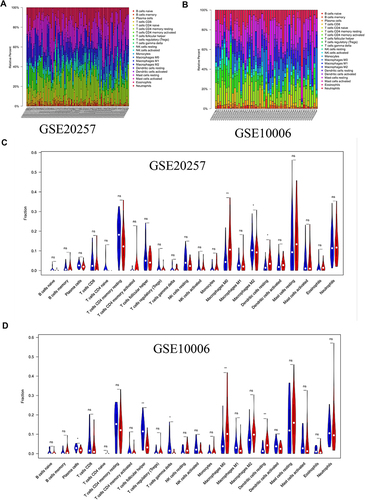
Figure 2 Identification of key immune cells and DEGs. (A) AUCs of three differentially distributed immune cells in GSE20257. (B) AUCs of five differentially distributed immune cells in GSE10006. (C) Volcano plot of DEGs in GSE20257. (D) Volcano plot of DEGs in GSE10006.
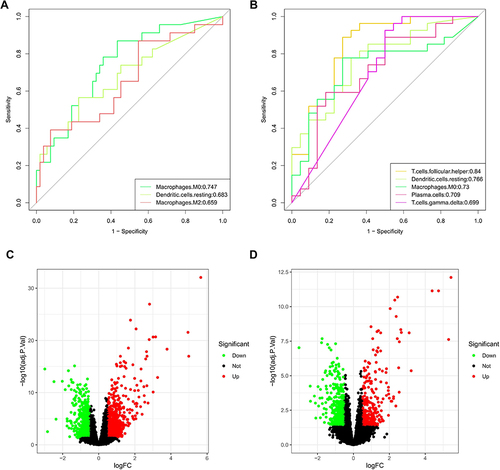
Figure 3 Determination of key modules associated with important immune cells. (A) Scale Independence and average connectivity in GSE20257. (B) Scale Independence and average connectivity in GSE10006. (C) Cluster dendrogram in GSE20257. (D) Cluster dendrogram in GSE10006. (E) Heatmap of correlation between modules and important immune cells in GSE20257. (F) Heatmap of correlation between modules and important immune cells in GSE10006.
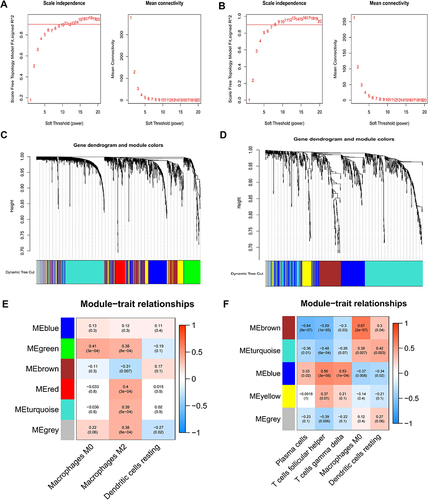
Figure 4 LASSO regression analysis for selection of trait genes. (A) 41 candidate genes were acquired via Venn diagram. (B) Donut plot of GO enrichment analyses. (C) Ten cross-validations of adjusted parameter selection in the LASSO model. Each curve corresponds to one gene. (D) LASSO coefficient analysis. Vertical dashed lines are plotted at the best penalty parameter.
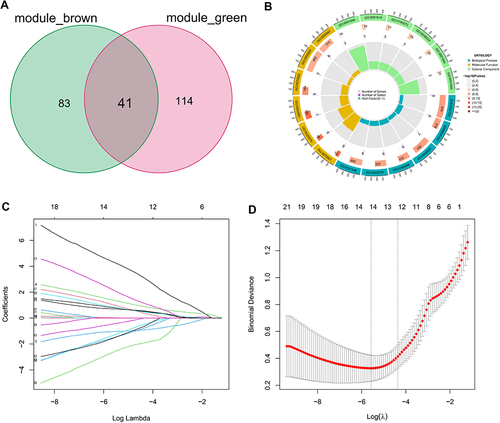
Table 2 Detailed Results of the Boruta and LASSO Algorithms
Figure 5 Identification of a 3-gene signature. Different results and expressions of CLEC5A, FTL and SLC2A3 between high- and low-score groups in GSE20257 (A), GSE10006 (D) and GSE8545 (G). AUC of predicted outcome in GSE20257 (B), GSE10006 (E) and GSE8545 (H). Expressions of CLEC5A, FTL and SLC2A3 in COPD patients and healthy controls in GSE20257 (C), GSE10006 (F) and GSE8545 (I). ns, no significance; **P < 0.01, ***P < 0.001.
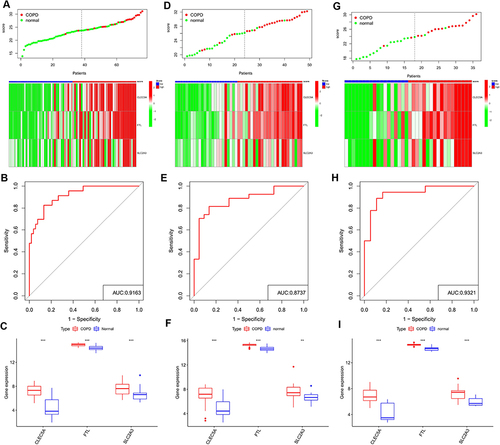
Figure 6 Analyses of single cell RNA sequencing data from lung tissue of COPD patients. (A) PCA was used for linear dimension reduction and the top 20 PCs were selected according to p-value. (B) UMAP plot of 9 cell subgroups shown by different colors. (C) Heat map showed the relative expression of marker genes for the 9 cell subgroups. Red represents high expression; blue represents low expression. (D and E) Expression of CLEC5A, FTL and SLC2A3 in the 9 cell subgroups.
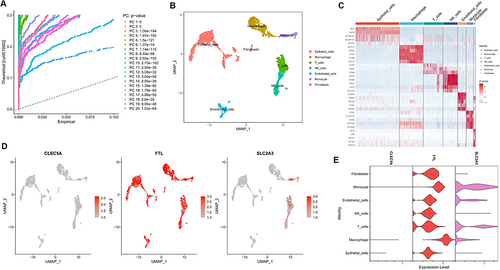
Figure 7 Expression of CLEC5A, FTL and SLC2A3 in THP-M cells co-cultured with CSE-treated HBE cells for 24 h. (A) Expression of CLEC5A mRNA. (B) Expression of FTL mRNA. (C) Expression of SLC2A3 mRNA. (D) Western blots. (E) Relative protein levels of CLEC5A, FTL and SLC2A3 were determined. The data are the mean ± SD (n=3). *P < 0.05.
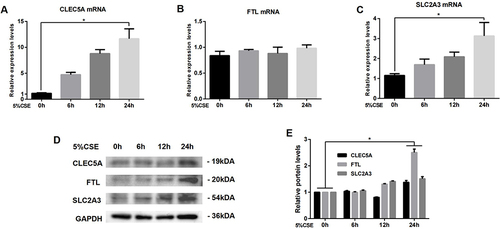
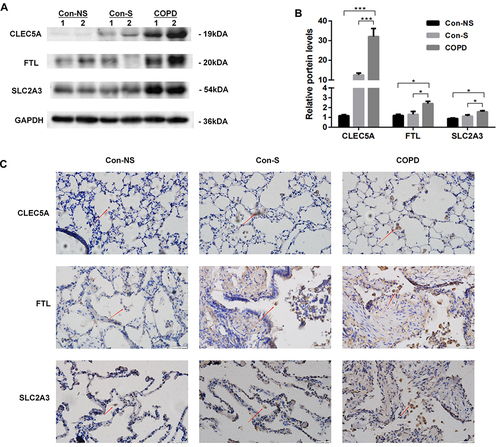
Figure 8 Expression of CLEC5A, FTL and SLC2A3 in COPD patients. (A) Western blots. (B) Relative protein levels of CLEC5A, FTL and SLC2A3 in lung were determined. Con-NS, nonsmokers without COPD; Con-S, smokers without COPD; COPD, COPD patients. Data are mean ± SD (n = 3). *P < 0.05, ***P < 0.001. (C) Immunohistochemical staining for CLEC5A, FTL and SLC2A3 in non-smokers, smokers, and COPD patients. Positive protein staining appeared brown and nuclear staining appeared blue. Red arrows pointed macrophages. Scale bar = 50μm, original magnification: ×400.