Figures & data
Table 1 Primers Sequence in RT-qPCR
Table 2 The Demographic Data of Recruited Subjects
Figure 1 DEmRNAs/DElncRNAs/DEcircRNAs in N, AR, and CARAS. (A) Venn diagram of DEmRNAs in N, AR, and CARAS. (B) The heatmap of common DEmRNAs in AR vs N and CARAS vs AR groups. (C) Venn diagram of DElncRNAs in N, AR, and CARAS. (D) The heatmap of common DElncRNAs in AR vs N and CARAS vs AR groups. (E) Venn diagram of DEcircRNAs in N, AR, and CARAS. (F) The heatmap of common DEcircRNAs in AR vs N and CARAS vs AR groups. The color scale represented the expression levels.
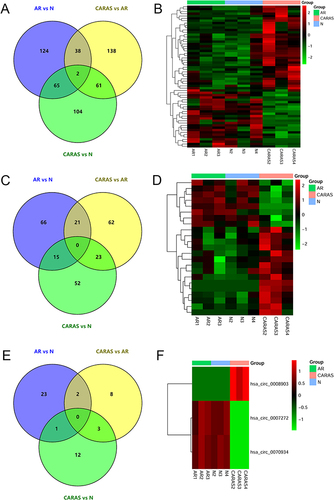
Figure 2 KEGG analysis (A), GSEA analysis (B), PPI network (C) and TF regulatory network (D) of common DEmRNAs in AR vs N and CARAS vs AR groups. Red and blue color represent up-regulation and down-regulation, respectively.
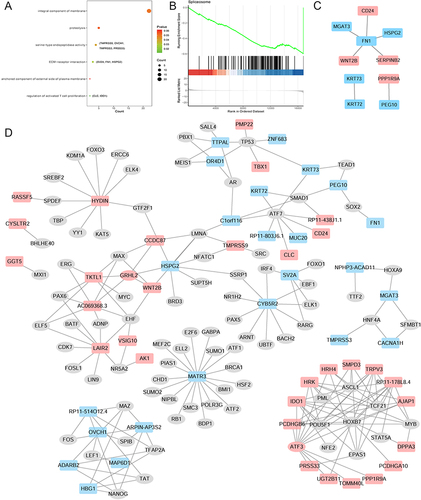
Figure 3 LncRNA-mRNA cis-regulatory (A), trans-regulatory (B) and circRNA-mRNA co-expressed (C) networks. The rectangles, triangles and inverted triangles indicate mRNAs, lncRNAs and circRNAs, respectively. Red and blue color represents the up-regulation and down-regulation, respectively.
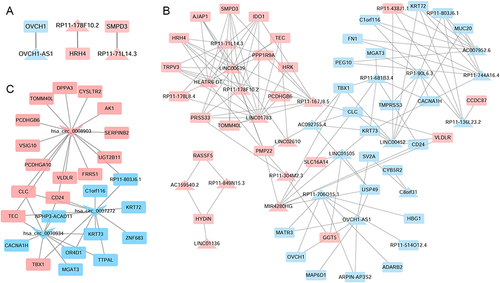
Figure 4 Validation in RT-qPCR. RT-qPCR, real time qPCR. Two-sample T-test was used for statistical analysis. **p < 0.01.
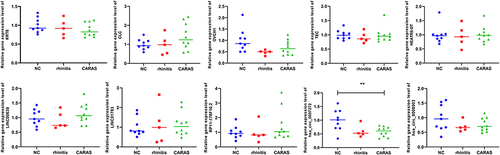
Figure 5 Validation in GSE19187 (A) and GSE141623 (B). ANOVA was used for statistical analysis.
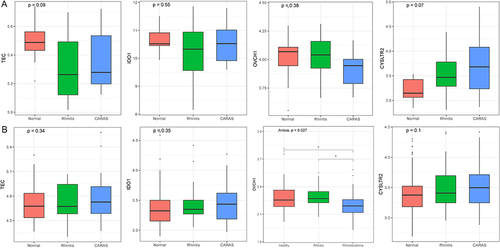
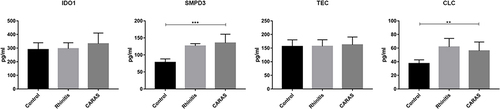
Figure 6 The protein expression validation by ELISA. Two-sample T-test was used for statistical analysis. **p < 0.01; ***p < 0.001.