Figures & data
Table 1 Baseline Characteristics of the Study Population
Table 2 Baseline Characteristics of the Patients Stratified by the Different AF Types
Table 3 Univariate and Multivariate Cox Regression Analysis for Predicting Recurrence in All Patients
Table 4 The Baseline Characteristics Based on Tertiles of the PLR for Patients with Nonparoxysmal AF
Table 5 Univariate and Multivariate Cox Regression Analysis for Predicting Recurrence in Patients with Nonparoxysmal AF
Figure 1 RCS for the odds ratio of risk of recurrence.
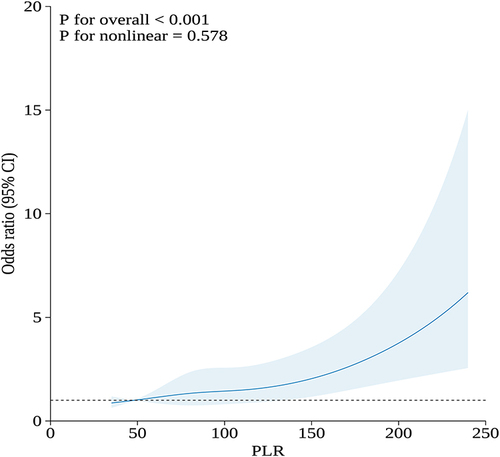
Figure 2 ROC curve analysis of the PLR, APPLE score and APPLE score plus PLR to predict recurrence in AF patients after catheter ablation. The area under the curve (AUC) of the APPLE score, PLR and addition of the PLR to the APPLE score for predicting recurrence was 0.645 (95% CI, 0.601 to 0.690; P < 0.001), 0.596 (95% CI, 0.557 to 0.634; P < 0.001) and 0.675 (95% CI, 0.629 to 0.722), respectively; APPLE vs APPLE + PLR, P=0.019; The circle on the curve indicates the point corresponding to the optimal cut-off value.
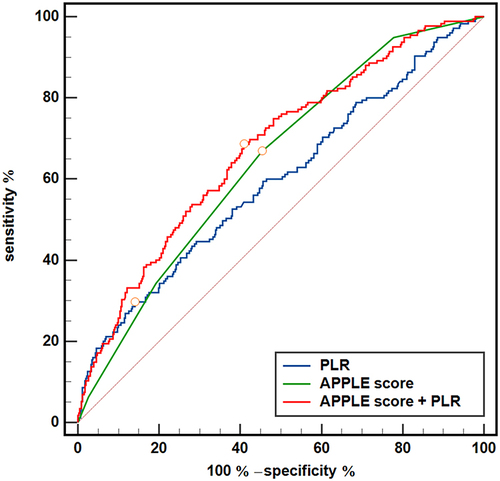
Figure 3 Kaplan‒Meier survival curves of AF recurrence for the PLR tertiles. The graph shows Kaplan–Meier estimates of freedom from any documented atrial arrhythmia after a single ablation procedure (log-rank P<0.01) in the T1 group (TyG index ≤ 75.6, red line), T2 group (75.6 < PLR ≤ 114.9, blue line), and T3 group (PLR> 114.9, green line).
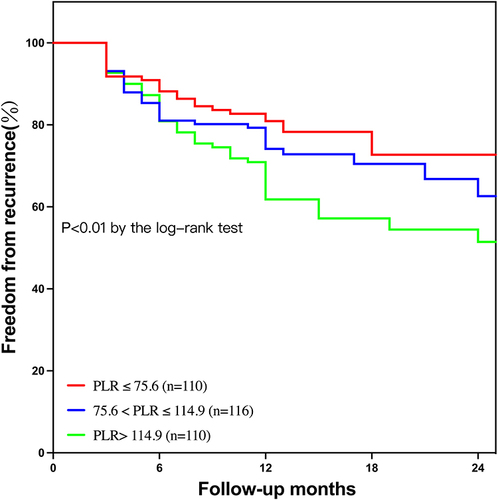
Figure 4 ROC curve analysis of the PLR, APPLE score and APPLE score plus PLR to predict recurrence in patients with nonparoxysmal atrial fibrillation. The PLR was stratified by the tertiles of the PLR (T1, PLR ≤ 75.6; T2, 75.6 < PLR ≤ 114.9; T3, PLR> 114.9). The LAD groups were stratified by the optimal cut-off value (LAD≥42 mm). The area under the curve (AUC) of the LAD, the PLR and the addition of the PLR to the LAD for predicting recurrence was 0.645 (95% CI, 0.601 to 0.690; P < 0.001), 0.596 (95% CI, 0.557 to 0.634; P < 0.001) and 0.675 (95% CI, 0.629 to 0.722), respectively. LAD vs LAD + PLR, P<0.001. The circle on the curve indicates the point corresponding to the optimal value.
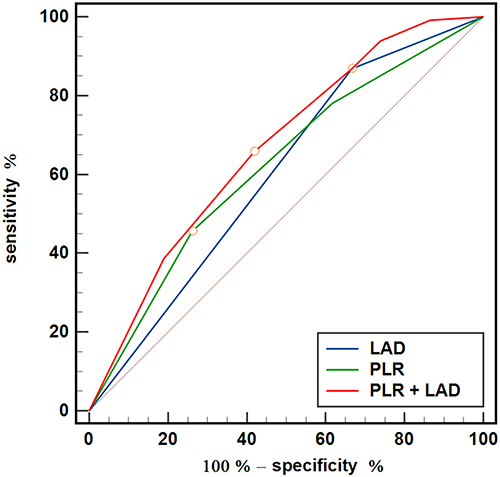
Table 6 Univariate and Multivariate Cox Regression Analysis for Predicting Recurrence in Patients with Paroxysmal AF
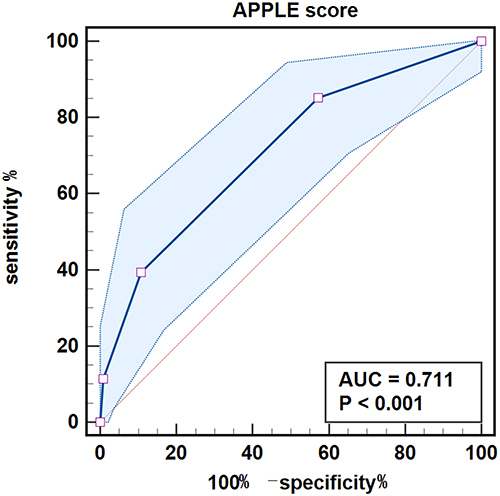
Figure 5 ROC curve analysis of the APPLE score to predict recurrence in patients with paroxysmal atrial fibrillation. The area under the curve (AUC) of the APPLE score for predicting recurrence was 0.711 (95% CI, 0.656 to 0.762; P < 0.001).