Figures & data
Table 1 Baseline Characteristics for Patients Stratified by Primary Events
Table 2 Baseline Characteristics for Patients Stratified by the Level of SII and Different Glycemic Metabolism Status
Table 3 Relation of the SII Level and Primary Endpoint in Patients with Different Glycemic Metabolism Status
Figure 1 Kaplan–Meier curves for the cumulative incidence of MACE according to different SII levels (A), glycemic metabolism status (B).
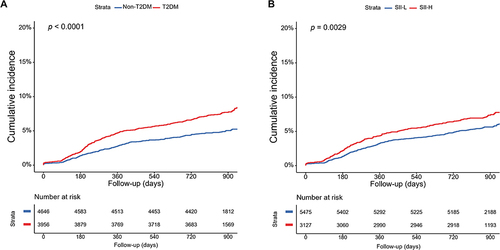
Table 4 Predictive Value of the SII Level and Different Glycemic Metabolism Status for Primary and Secondary Endpoints
Figure 2 Incidence rate for MACE (A) and Kaplan–Meier curves for the cumulative incidence of MACE (B) according to four groups.
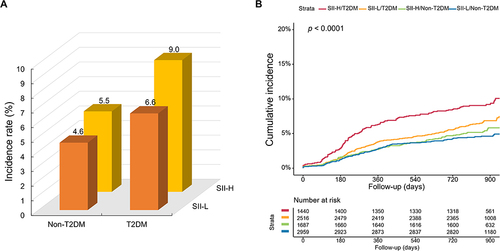
Figure 3 Hazard ratios (95% CI) for MACE according to four groups.
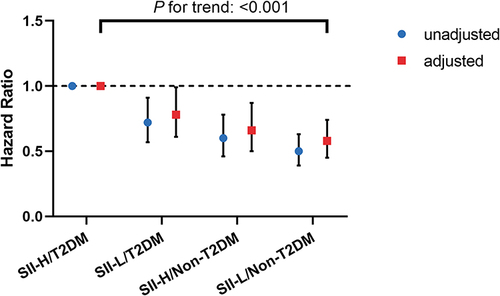
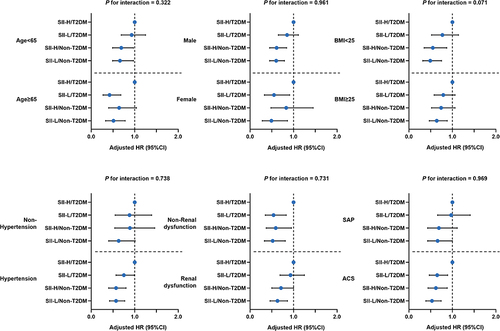
Figure 4 Forest plot of MACE according to different subgroups.