Figures & data
Figure 1 Flow of study population and selection criteria.
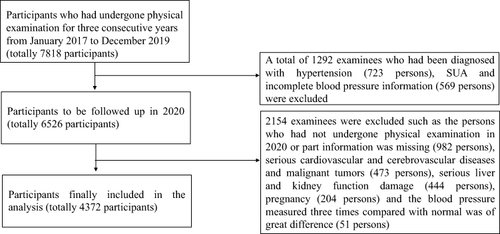
Figure 2 SUA trajectory grouping.
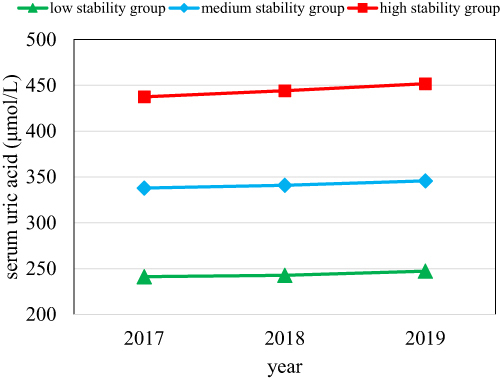
Table 1 Comparison of Baseline Data of Different SUA Trajectories
Table 2 Single Factor Cox Regression Results of Hypertension Risk
Table 3 Risk Model of Hypertension in Different SUA Trajectories
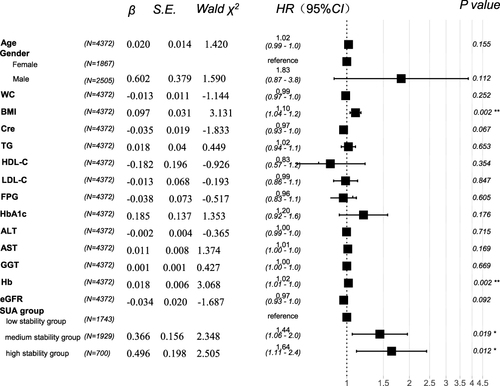
Figure 3 Multifactor COX proportional risk regression analysis.
Notes: *or**asterisk represented P value <0.05 or 0.01 respectively; β: regression coefficient.
Abbreviations: SE, standard error; Wald χ2, Wald chi-squared value; HR, hazard ratio; CI, confidence interval; BMI, body mass index; WC, waist circumference; Hb, hemoglobin; ALT, alanine aminotransferase; AST, glutamic oxaloacetic transaminase; GGT, γ-Glutamyl transpeptidase; Cre, creatinine; eGFR, estimated glomerular filtration rate; TG, triglyceride; HDL-C, high density lipoprotein cholesterol; LDL-C, low density lipoprotein cholesterol; FPG, fasting plasma glucose; HbA1c, glycosylated hemoglobin; SUA, serum uric acid.