
Figures & data
Table 1 Baseline Data of the Survivor Group and Nonsurvivor Group
Figure 1 The dynamic changes in Galectin-3 and NIHSS scores and the correlation between them.
Notes: The dynamic changes in Galectin-3 levels (A) and NIHSS scores (B) in all patients. The relationship between Galectin-3 levels and NIHSS scores before (C), 1 day (D), 3 days (E), and 7 days (F) was determined by Pearson correlation analysis (all P < 0.05). #Indicates P < 0.05 vs preoperation, *Indicates P < 0.05 vs 1 day from (A and B).
Abbreviations: Pre, preoperation; 1d, 1 day after the operation; 3d, 3 days after the operation; 7d, 7 days after the operation; NIHSS, National Institute of Health Stroke Scale.
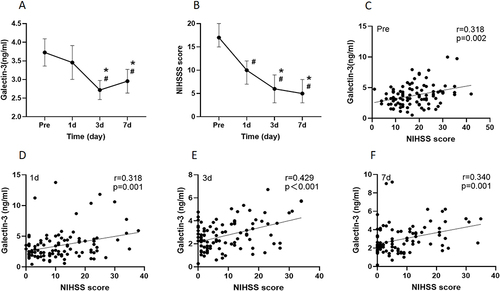
Table 2 Subgroup Analysis of the Dynamic Changes in Galectin-3 Levels
Figure 2 Dynamic changes in Galectin-3 levels and NIHSS score and their predictive value for death.
Notes: The dynamic changes in the Galectin-3 levels (A) and NIHSS scores (B) between the nonsurvivor group and survivor group. The dynamic changes in the Galectin-3 levels between the poor prognosis group and favorable prognosis group (C) and between the END group and non-END group (D). The predictive value of Galectin-3 (E) and the NIHSS score (F) for death events at 1 day, 3 days, and 7 days was determined using an ROC curve. A linear mixed effects model was used to compare the two groups and compare the different time periods within the groups. #Indicates P < 0.05 vs the survivor group, the favorable group and the non-END group from (A–D); *Indicates P < 0.05 vs pre; ※Indicates P < 0.05 vs 1 day from (A–D). § indicates P < 0.05 vs pre in poor prognosis group (C).
Abbreviations: Pre, preoperation; 1d, 1 day after the operation; 3d, 3 days after the operation; 7d, 7 days after the operation; NIHSS, National Institute of Health Stroke Scale; END, early neurological deterioration; Non-END, Nonearly neurological deterioration.
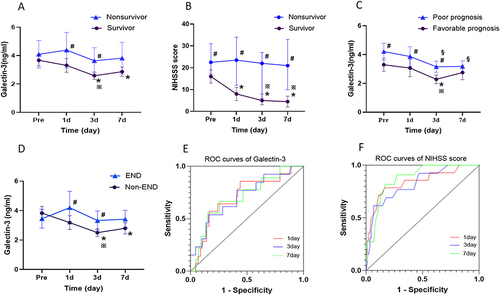
Table 3 ROC Curve Analysis of the Ability of Galectin-3 Levels and NIHSS Score to Predict Death