Figures & data
Table 1 General Characteristics and Laboratory Findings of Patients with Mild, Severe, and Critical COVID-19
Figure 1 Changes in lymphocyte subset proportions and corresponding MMP in patients with mild, severe, and critical COVID-19. (A) Proportional of T, B, and NK subsets among lymphocyte; (B) absolute count of T, B, and NK subsets; (C) proportional of MMPlow cells in s T, B, and NK cells. Unpaired t-tests or Mann–Whitney U-test was used for statistical analysis among two groups: *p < 0.05, **p < 0.01, ***p < 0.001, and ****p < 0.0001.
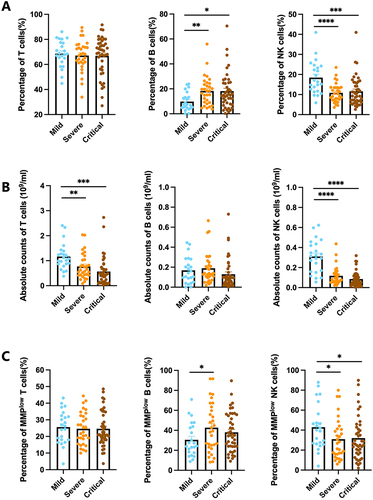
Table 2 General Characteristics and Laboratory Findings of Patients with Critical COVID-19 Who Survived or Died
Figure 2 Differences in proportions and mitochondrial membrane potential of B and NK cell subsets between deceased and surviving critically ill patients. (A) Proportional of B and NK cell subsets among lymphocytes between deceased and surviving critically ill patients. (B) Proportional of of MMPlow B and NK cells in deceased and surviving critically ill patients. (C) MMP MFI within B and NK cell subsets in deceased and surviving critically ill patients. Unpaired t-tests or Mann–Whitney U-test were used for statistical analysis. Data shown as mean ± standard error mean, ns: not significant, *p < 0.05, **p < 0.01.
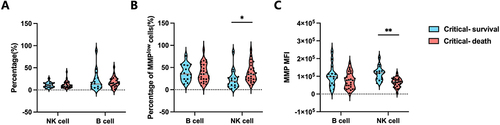
Table 3 Feature Importance and Importance Rank in Random Forest Model
Figure 3 Changes in clinical parameters in deceased and surviving patients with critical COVID-19. (A) Levels of coagulation markers PT, APTT, TT, INR, Fbg, and D-dimer in deceased and surviving critically ill patients. (B) Levels of myocardial injury markers NT-proBNP, CK, hscTnI, and Myo in deceased and surviving critically ill patients. (C) Levels of infection-related markers CRP and PCT and coagulation markers PT, APTT, TT, INR, Fbg, and D-dimer between patient groups. (D) Differences in levels of cytokines IL-6, IL-8, IL-10, and TNF-α between patient groups. Unpaired t-tests or Mann–Whitney U-test were used for statistical analysis. Data shown as mean ± standard error mean, ns: not significant, *p < 0.05.
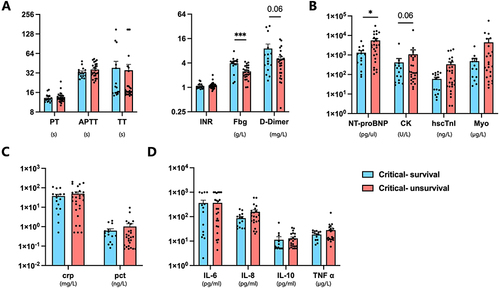
Figure 4 Correlation analysis between MMP MFI of NK cells in deceased patients and coagulation-related clinical parameters. (A) Overview of pairwise correlation analysis between NK cell MMP MFI and coagulation-related clinical parameters (PT, APTT, Fbg, TT, and D-dimer levels) in deceased critically ill patients. (B) Correlation analysis between NK cell MMP MFI and D-dimer levels in deceased critically ill patients. Pearson’s correlation analysis was used for analyses.
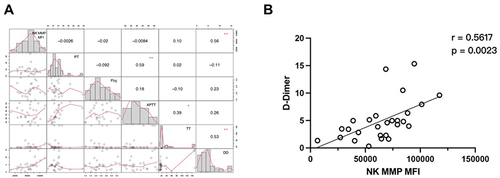
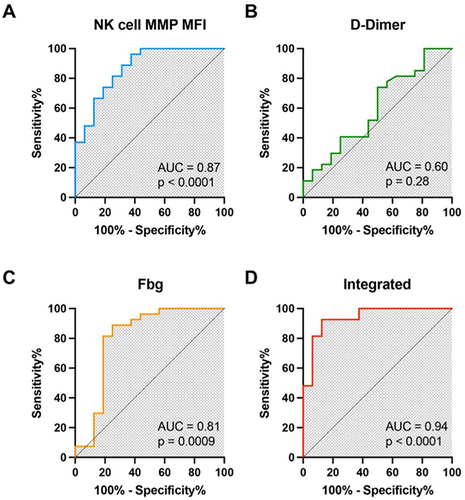
Figure 5 Diagnostic value and combined diagnostic model of NK cell MMP MFI and clinical features. (A-C) ROC curve of NK cell MMP MFI (a), D-dimer level (b), and Fbg level (c) to distinguish between death and survival of critically ill patients. (D) ROC curve of combined diagnostic model including NK cell MMP MFI, Fbg level, and D-dimer level.