
Figures & data
Table 1 Basic Clinical Characteristics Between MACE and Non-MACE Groups in STEMI Patients
Table 2 Univariate Cox Proportional Hazard Regression Analysis of MACEs Occurrence Within 1 Year of Hospital Discharge in Patients with STEMI After PCI
Table 3 Multivariable Cox Proportional Hazard Regression Analysis of MACEs Occurrence Within 1 Year of Hospital Discharge in Patients with STEMI After PCI
Figure 1 Receiver operating characteristic (ROC) curves. (A) ROC curve of LCR at admission in predicting MACEs; (B) ROC curve of LCR 24 hours post-PCI in predicting MACEs.
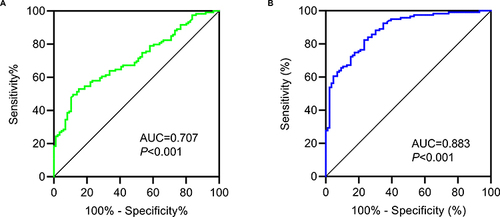
Figure 2 Kaplan–Meier survival analysis. (A) Patients with low LCR values at admission (LCR at admission ≤ 50.29) had a much higher risk of MACEs compared to that in patients with a high value (LCR at admission > 50.29); (B) Patients with a low value of LCR at 24 hours post-PCI (LCR at 24 hours post-PCI ≤ 2.25) had a much higher risk of MACEs compared to that in patients with a high value (LCR at 24 hours post-PCI > 2.25).
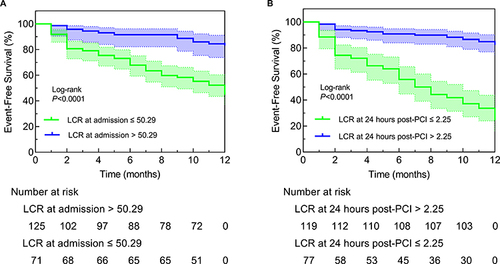
Figure 3 Kaplan–Meier survival analysis. (A) LCR at admission predicts the risk of cardiac death in STEMI patients; (B) LCR at 24 hours post-PCI predicts the risk of cardiac death in STEMI patients; (C) LCR at admission predicts the risk of heart failure in STEMI patients; (D) LCR at 24 hours post-PCI predicts the risk of heart failure in STEMI patients; (E) LCR at admission predicts the risk of unstable angina pectoris after stenting in STEMI patients; (F) LCR at 24 hours post-PCI predicts the risk of unstable angina pectoris after stenting in STEMI patients; (G) LCR at admission predicts the risk of non-fatal myocardial infarction in STEMI patients; (H) LCR at 24 hours post-PCI predicts the risk of non-fatal myocardial infarction in STEMI patients.
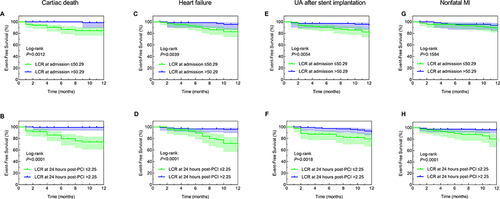
Figure 4 Correlation of LCR at 24 hours post-PCI with Gensini score, TIMI flow, and mitral regurgitation. (A) Spearman correlation analysis between Gensini score and LCR at 24 hours post-PCI; (B) The no-reflow group had a lower level of LCR at 24 hours post-PCI compared to that in the reflow group; (C) The mitral regurgitation group had a lower level of LCR at 24 hours post-PCI compared to that in the non-mitral regurgitation group.
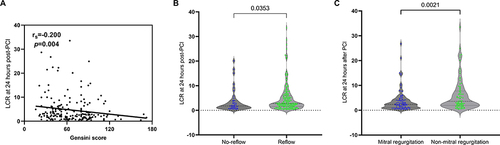
Figure 5 Correlation of LCR at 24 hours post-PCI with Lp(a), D-dimer, fibrinogen and LVEF. (A) Spearman correlation analysis between Lp(a) and LCR at 24 hours post-PCI; (B) Spearman correlation analysis between D-dimer and LCR at 24 hours post-PCI; (C) Spearman correlation analysis between fibrinogen and LCR at 24 hours post-PCI; (D) Spearman correlation analysis between LVEF and LCR at 24 hours post-PCI.
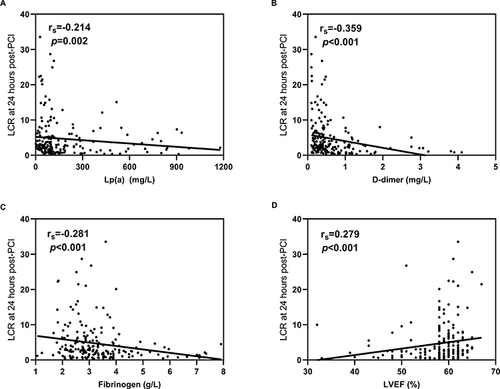
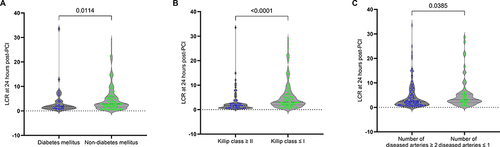
Figure 6 Correlation of LCR at 24 hours post-PCI with diabetes mellitus, Killip class, and number of diseased arteries. (A) The diabetes mellitus group had a lower level of LCR at 24 hours post-PCI compared to that in the non-diabetes mellitus group; (B) The Killip class ≥ II group had a lower level of LCR at 24 hours post-PCI compared to that in the Killip class ≤ I group; (C) The number of diseased arteries ≥ 2 group had a lower level of LCR at 24 hours post-PCI compared to that in the number of diseased arteries ≤ 1 group.
Data Sharing Statement
Data from this study are available from the corresponding author upon request.