
Figures & data
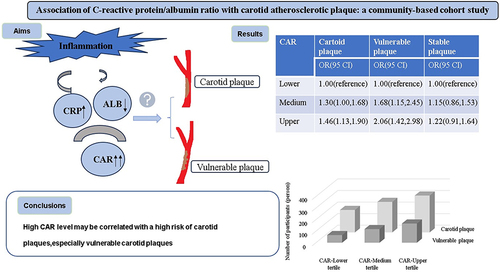
Figure 1 Flow chart of the study participants.
Abbreviations: MRI, magnetic resonance imaging; TCD, transcranial Doppler.
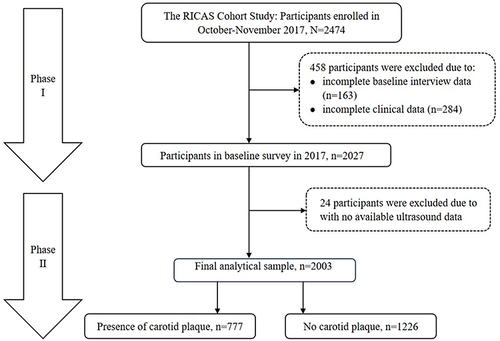
Table 1 Baseline Characteristics of Study Participants
Table 2 Association of CAR with Carotid Plaque
Figure 2 The participants distribution of carotid plaque and vulnerable plaque in different CAR levels.
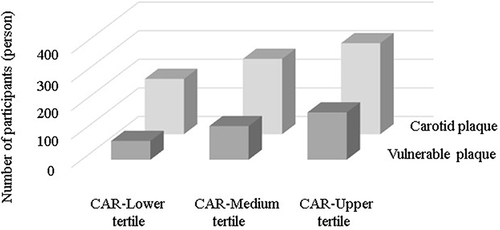
Table 3 Association of CAR with Stable and Vulnerable Plaque
Data Sharing Statement
The raw data supporting the conclusions of this article will be made available by the corresponding author.