
Figures & data
Table 1 Baseline Characteristics of Surviving and Non-Surviving Patients
Figure 1 Study flow diagram.
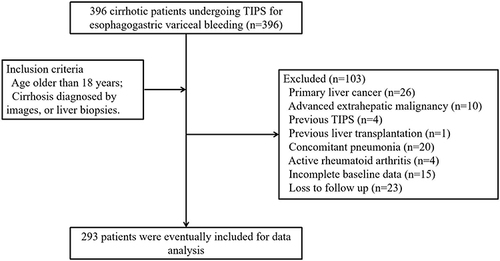
Figure 2 Distribution of NLR in different subgroups. (A) Early TIPS; (B) Splenectomy; (C) Etiologies; (D) Child-Pugh grade.
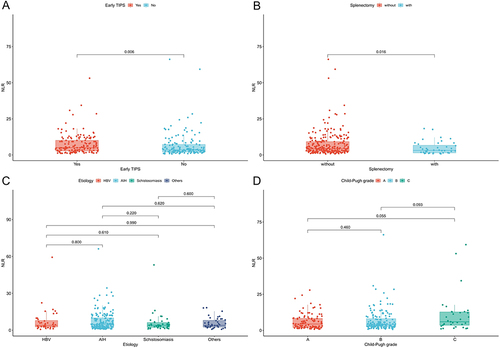
Figure 3 ROC curve to determine the cut-off value of the NLR for the prediction of 2-year mortality in EGVB patients undergoing TIPS. The optimal cut-off values for NLR (A), age (B), and creatinine (B) are 4.9, 63.0 and 71.9 respectively.
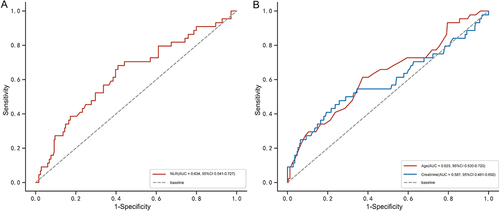
Figure 4 Kaplan Meier survival curves after TIPS placement, by pre-TIPS NLR (A), age (B), and gender (C).
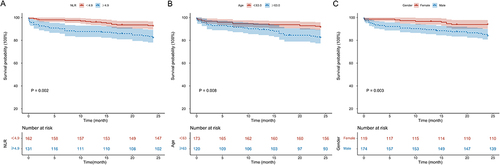
Table 2 Univariate and Multivariate Analysis of Risk Factors for 2-Year Mortality After TIPS
Figure 5 NLR-driven subgroup analysis of survival outcomes in EGVB patients following TIPS procedures.
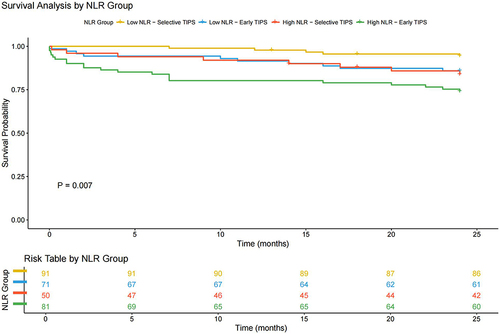
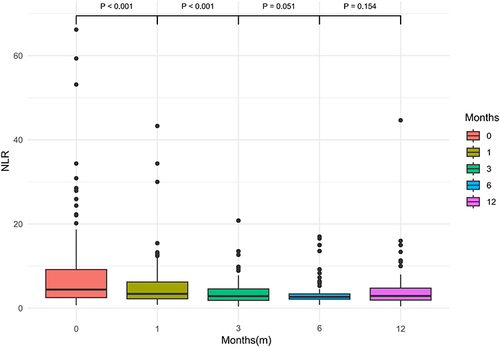
Figure 6 Box plots of NLR values at different time points post-TIPS placement. Comparing NLR values at 1 month, 3 months, 6 months, and 12 months post-TIPS to the previous time point yielded P values of < 0.001, < 0.001, 0.051, and 0.154, respectively.
Data Sharing Statement
All data generated or analyzed during this study are included in this article. Further enquiries can be directed to the corresponding author (Wei-Dong Wang).