Figures & data
Table 1 Basic Information of Datasets
Figure 1 Designing of this research.
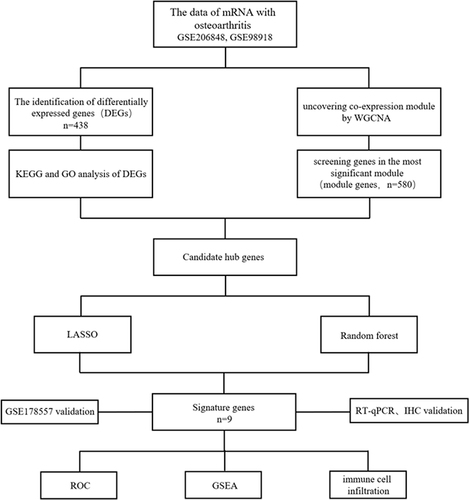
Figure 2 Differential analysis of genes in OA.
Notes: (a) Heatmaps and volcano plots were identified from the intersection dataset. (b) Upregulated and downregulated genes were shown in red and green triangles.
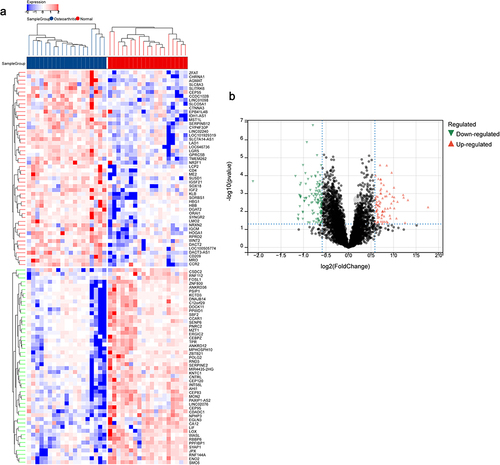
Figure 3 Enrichment analysis of DEGs in OA.
Notes: (a) KEGG pathway analysis in OA. Significant pathways and genes were listed using different sizes and colors. (b) The top ten relevant functions were presented separately in the GO analysis.
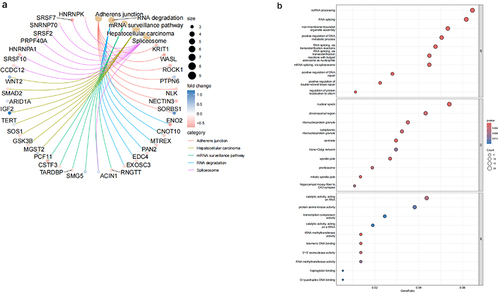
Figure 4 Module genes using WGCNA in OA.
Notes: (a and b) C To pursue the smoothness of the curve, β = 7 was set as the standard. (c) Different gene modules were indicated in different colors. (d) Heatmap of eigengene adjacency. (e and f). The blue module was most associated with OA.
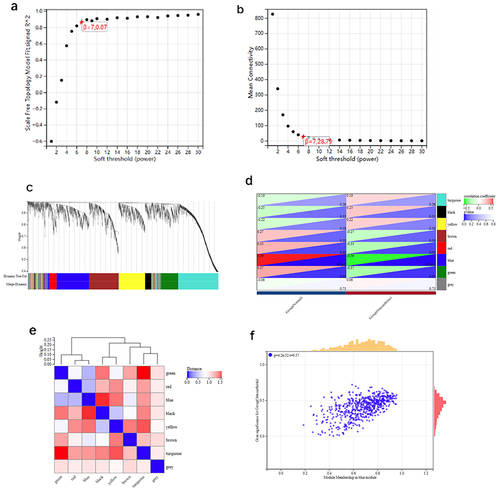
Figure 5 Analysis of the genes of DEGs and key modules.
Notes: (a) The Venn diagram shows the 190 intersection genes. (b–e) Analysis of intersection genes. (f) The most related genes were displayed using cytoHubba plug-in. (g) Presentation of gene nodes.
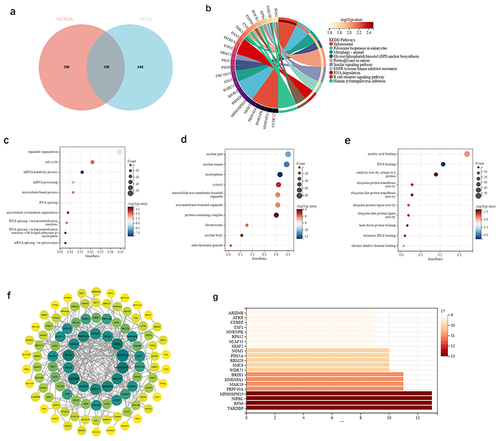
Table 2 Analysis Results of Machine Learning
Figure 6 Machine learning was used to screen the diagnostic genes of OA.
Notes: (a and b) Thirteen diagnostic genes were identified through the LASSO model curve and optimization. (c and d) The top 20 candidate genes identified based on scoring statistics. (e) The Venn diagram shows the 9 intersection genes.
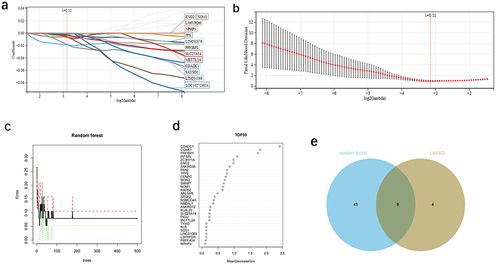
Figure 7 The model genes expression.
Notes: (a) Gene expression in the training set. (b) The diagnostic efficiency of genes in the training set was evaluated. (c) The diagnostic efficacy of GSE178557 gene was evaluated. (d) Relevant mRNA expression levels were obtained by comparing Ct values. n=3, *p < 0.05, **p < 0.01, ***p < 0.001.
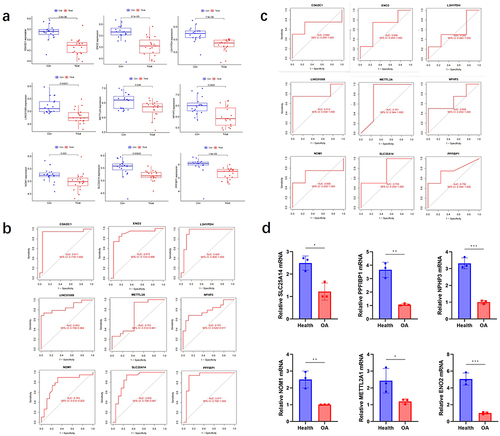
Figure 8 Analysis of the model genes in OA.
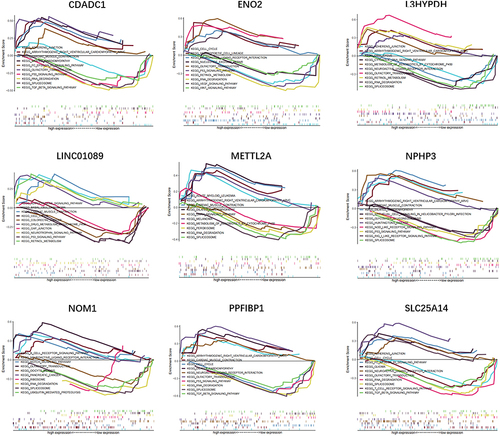
Figure 9 Immune cell infiltration analysis.
Notes: (a) Trends in the distribution of immune cells between OA and healthy group samples. (b) The vioplot plot was used for immune correlation analysis. *p < 0.05, **p < 0.01, ***p < 0.001. (c) Correlations between different immune cell types.
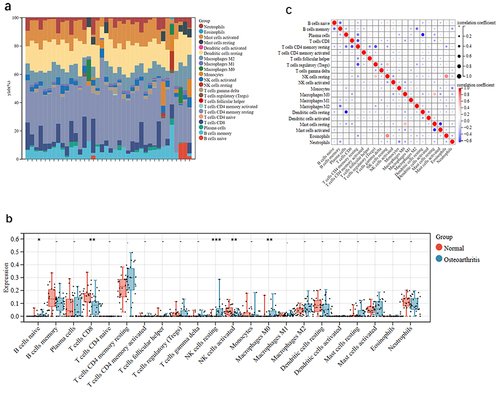
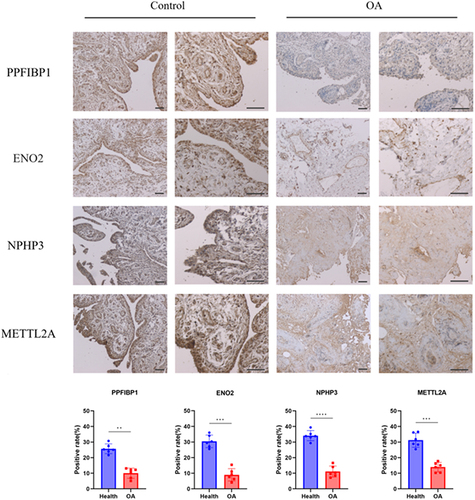
Figure 10 Typical IHC graphics of signature genes staining in synovium.
Notes: The positive area ratio shows the expression of PPFIBP1, ENO2, NPHP3, and METTL2A in two groups (Microscope objectives: 4×, 10×. n=6, **p < 0.01, ***p < 0.001, ****p < 0.0001).