Figures & data
Table 1 Disease Activity Index (DAI) Score Table
Table 2 Qualitative Results of the Components in MEO by GC-MS
Figure 1 GC-MS chromatogram of MEO and the structure of its components. (A) Total ion flow map of MEO. (B) Structures of 23 components in MEO.
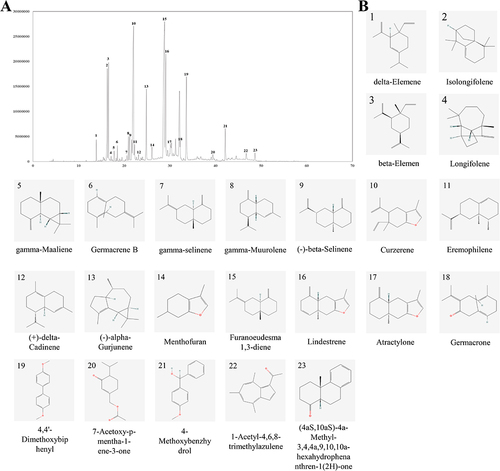
Figure 2 The effect of MEO on cell viability in RAW264.7 macrophages. (A) Cell viability was measured by MTT cell viability assay. (B) Effect of MEO on NO production in LPS-induced RAW264.7 macrophages. (C) Effect of MEO on TNF-α production in RAW264.7. (D) Effect of MEO on IL-1β production in RAW264.7.
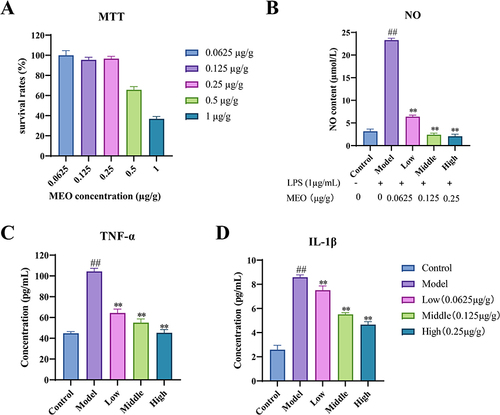
Figure 3 The DAI, colon morphology and serum levels of TNF-α and IL-1β in colitis mice. (A) DAI scores. (B) Changes in the body weight in each group. (C) Morphological analysis of the colon in each group. (D) Differences in colon length in each mice group. (E) The levels of TNF-α in colon tissues of colitis mice. (F) The levels of IL-1β in colon tissues of colitis mice.
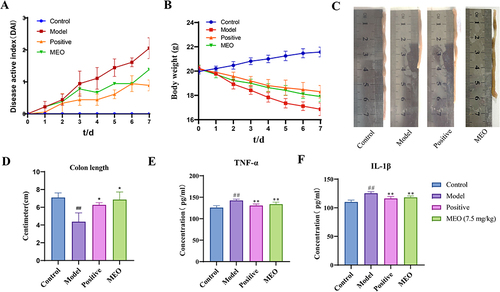
Figure 4 Results of RNA-seq analysis in colitis mice with MEO. (A) PCA graph. (B) Volcano graph. (C) Heat map of DEGs. (D) KEGG enrichment results. (E) GO enrichment results.
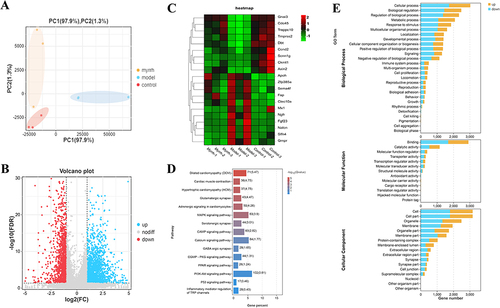
Figure 5 Results of WGCNA. (A) Selection of the soft threshold value. (B) Gene clustering tree and module division. (C) Gene number distribution in each module. (D) Heat map for correlation analysis between two modules. (E) Heat map of gene expression and inter-module correlation analysis. (F) Results of correlation analysis of trait modules. (G) KEGG results enriched by the blue modules.
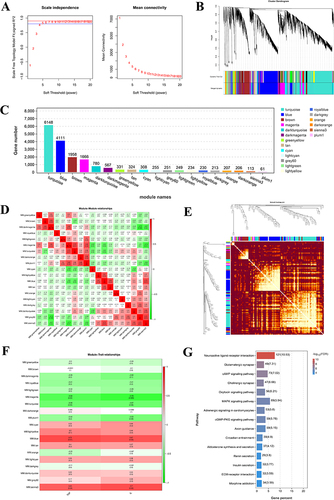
Figure 6 The results of MEO component–target network analysis and KEGG pathway enrichment analysis. (A) Intersection map of MEO targets, ulcerative colitis targets, and DEGs. (B) Component-target map of MEO. (C) PPI network map of the key targets. (D) KEGG enrichment analysis before introducing weighting coefficients. (E) KEGG enrichment analysis after introducing weighting coefficients.
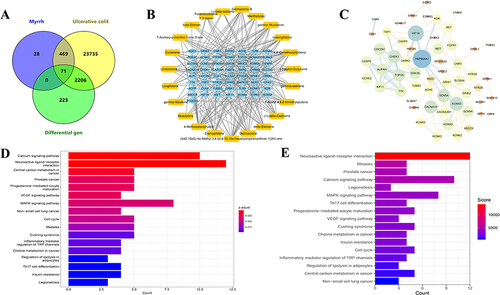
Table 3 The Docking Scores of Key Targets with Active Components and Specific Ligands
Figure 7 Molecular docking and thermogram results of the key targets with active components and specific ligands. (A) the docking results of 7mix protein of CACNA2D1 target with the specific ligand Gabapentin. (B) the docking results of 7mix protein of CACNA2D1 target with the gamma-Muurolene component. (C) the docking results of 3kkq protein of RAS target with the specific ligand Sotorasib. (D) the docking results of 3kkq protein of RAS target with the Curzerene component. (E) the docking results of 2ok1 protein of ERK target with the specific ligand Acetylsalicylic acid. (F) the docking results of 2ok1 protein of ERK target with the beta-Elemene component. (G) the docking results of 3v6r protein of JNK target with the specific ligand Halicin. (H) the docking results of 3v6r protein of JNK target with the Furanoeudesma 1.3-diene component. (I) the heat map of molecular docking.
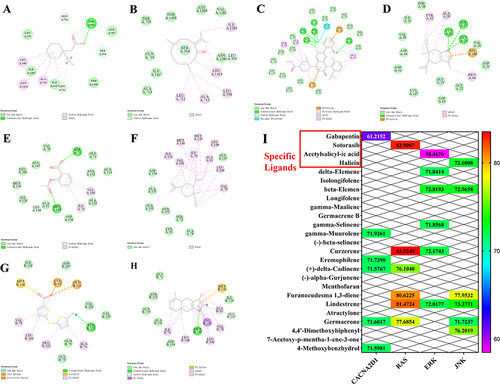
Figure 8 The DAI score and colon morphology in colitis mice. (A) DAI scores. (B) Changes in the body weight of in each group. (C) Morphological analysis of the colon in different group. (D) Differences in colon length in each mice group. ##P< 0.01 vs control group.
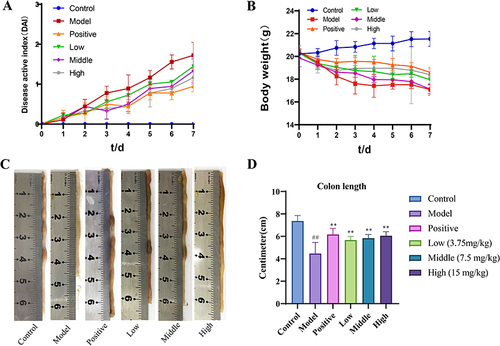
Figure 9 The Results of MEO inhibition of serum inflammatory factor levels and effects on colonic histopathology in colitis mice. (A) Serum TNF-α levels of each mice group. (B) Serum IL-1β levels of each mice group. (C) Effect of MEO on DSS-induced histopathological changes in the colon. The yellow arrows show goblet cells in the normal colon, and the black arrow indicates inflammatory infiltration.
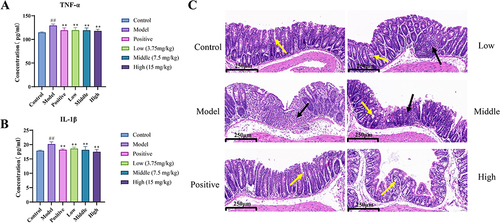
Figure 10 The Results Immunohistochemistry. (A) Effect of MEO on the levels of p-JNK, p-ERK, and TNF-α protein in DSS-induced colon tissues. (B) Protein levels of p-JNK in colon tissues of each mice group. (C) Protein levels of P-ERK in colon tissues of each mice group. (D) Protein levels of TNF-α in colon tissues of each mice group.
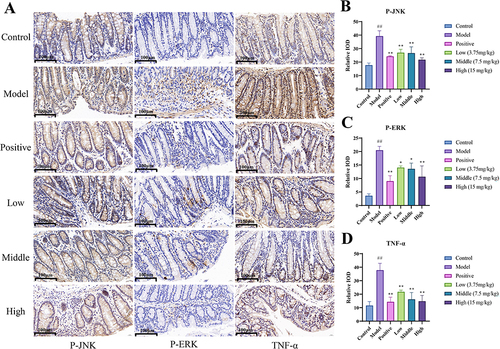
Figure 11 The results of Western blot. (A) Changes in the levels of P-JNK, JNK, P-ERK, and ERK in DSS-induced colon tissues after treatment with MEO. (B) Protein levels of p-JNK/JNK in colon tissues of each mice group. (C) Protein levels of p-ERK/ERK in colon tissues of each mice group.
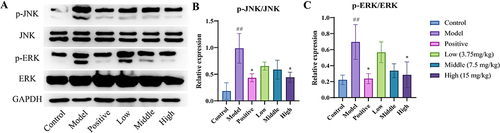
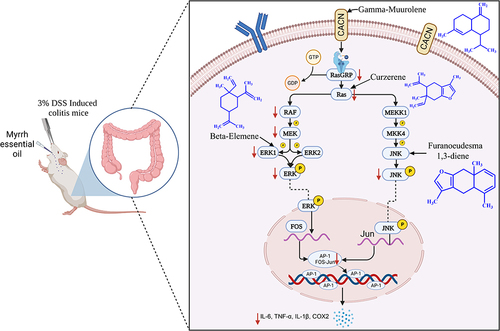
Figure 12 The mechanism of MEO in the treatment of colitis through the MAPK pathway.