Figures & data
Figure 1 Ovalbumin sensitization and challenge protocol.
Abbreviations: EC, endothelial cell; IP intraperitoneal.
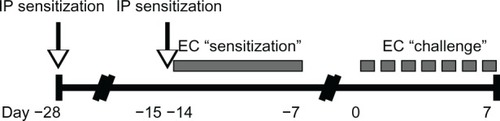
Figure 2 AD characteristic histologic changes in OVA challenged mice. (A) Histology was analyzed at 1, 3, and 7 days of challenge and compared to skin of untreated mice, revealing a progression of characteristic histologic changes, including acanthosis, spongiosis, hyperkeratosis, dermal inflammation, and dermal thickening. Images, shown at 20× (upper) and 40× (lower) magnifications, are representative of three mice per time point. (B) Secondary changes included erosion, crust, and impetiginization.
Abbreviations: AD, atopic dermatitis; OVA, ovalbumin.
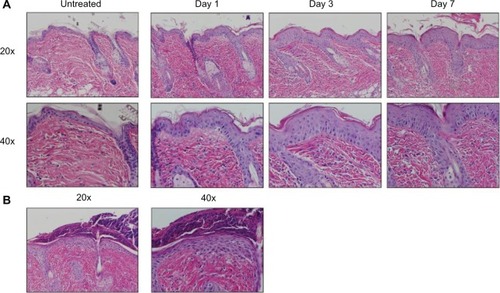
Figure 3 CD4+ T cell and CD11c+ DC dominant inflammatory cell phenotype in OVA-challenged mice. (A) Upper panel shows a prominent, largely perivascular and perifollicular influx of CD4+ T cells. Lower panel shows a dramatic accumulation of CD11c+ DCs. (B) The CD11c+ population was CD103− and langerin negative. Rare double-positive cells presumably represent the minority steady-state DC subpopulation. (C) The majority of the inflammatory CD11c+ cells co-expressed CD11b, CD206, CD86, and CD36.
Abbreviations: CD, cluster of differentiation; DC, dendritic cell; OVA, ovalbumin.
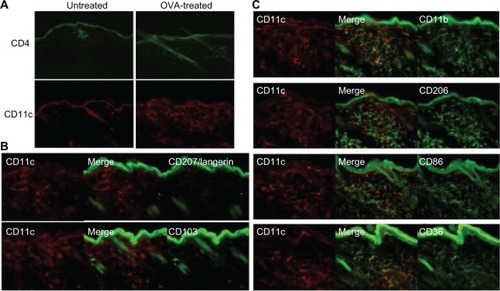
Figure 4 Elevated tissue IL-4 expression and circulating OVA-specific IgE in OVA-challenged mice. (A and B) IL-4 and IFN-γ mRNA levels were measured by qRT-PCR. IL-4 increased over time, while IFN-γ decreased. (C) Serum OVA-specific IgE was measured by ELISA. Compared to nondetectable (ND) levels in sham-treated mice, there was a significant increase in IgE levels as early as day 1 in OVA-treated mice, with a continued increase over time. Data are presented as mean ± SEM of two (day 7) or four (days 1, 3) sham-treated mice, and five (days 1, 7) or nine (day 3) OVA-treated mice.
Abbreviations: DC, dendritic cell; ELISA, enzyme linked immunosorbent assay; OVA, ovalbumin; IFN, interferon; IL, interleukin; mRNA, messenger ribonucleic acid; ND, nondetectable; qRT-PCR, quantitative reverse transcription polymerase chain reaction; SEM, standard error of the mean.
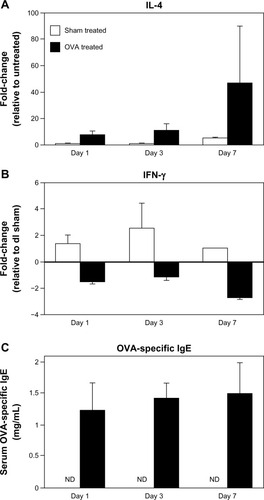
Figure 5 DC and lymphocyte trends in SDLNS of OVA-challenged mice. (A) CD11c+ DCs were increased in SDLNs within the first 24 hours of challenge and continued to accumulate over time. (B) There was a progressive decrease in T (CD3+) versus B (B220+) cells through day 3 of challenge. (C) In addition, there was an early proliferation of CD4+CD25+ Tregs at day 1, with the proportion of Tregs decreasing thereafter. Data are presented as mean ± SEM of five mice at each time point.
Abbreviations: CD, cluster of differentiation; DC, dendritic cell; OVA, ovalbumin; SDLN, skin-draining lymph node; SEM, standard error of the mean; Tregs, T regulatory cells.
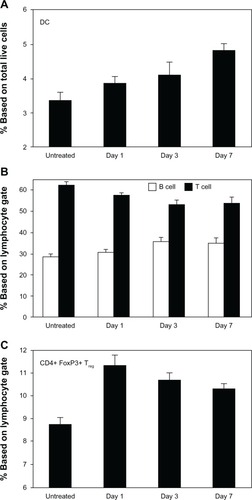
Figure 6 CD103 (αE subunit) is upregulated in SDLNS but is not necessary for skin homing. (A) Percent of CD4+ T cells (upper) and CD4+FoxP3+ Tregs (lower) that were positive for CD103, demonstrating progressive upregulation of CD103 expression over time between both populations. Data are presented as mean ± SEM of five mice at each time point. (B) CD103 was expressed on approximately 50% of lesional CD4+ cells. CD103 was also expressed on CD8+ T cells and a small fraction of DCs (not shown), which accounts for scattered single-positive CD103+ cells.
Abbreviations: CD, cluster of differentiation; DC, dendritic cell; SDLN, skin-draining lymph nodes; SEM, standard error of the mean; Tregs, T regulatory cells.
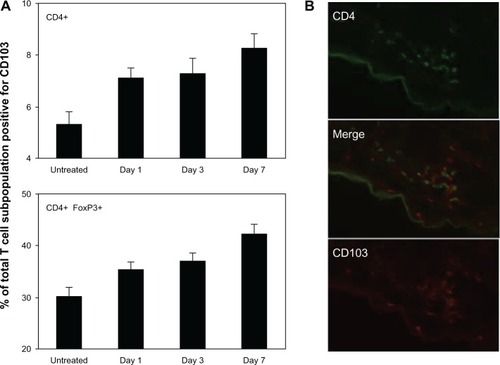
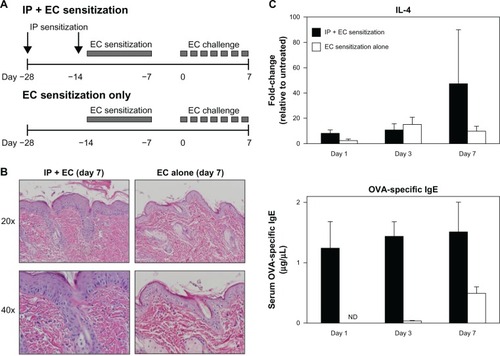
Figure 7 Systemic sensitization augments local sensitization alone in elicitation of an AD phenotype. (A) Diagrams comparing OVA sensitization and challenge protocols with (above; previously described) and without (below) IP sensitization. (B) Mice sensitized by EC route alone (right) showed less pronounced histologic changes compared to mice sensitized by both IP and EC route (left). (C) Mice sensitized by EC route alone (white) showed less robust elevations in tissue IL-4 mRNA and circulating OVA-specific IgE compared to mice sensitized by both IP and EC route (black).
Notes: Data are presented as mean ± SEM of five (days 1, 7) or nine (day 3) IP + EC sensitized mice and three (day 7) or four (day 1, 3) EC sensitized mice.
Abbreviations: DC, dendritic cell; EC, endothelial cell; OVA, ovalbumin; IFN, interferon; IL, interleukin; IP, intraperitoneal; mRNA, messenger ribonucleic acid; ND, no data; SEM, standard error of the mean.