Figures & data
Figure 1 Effect of CpG-ODN on cell viability in DU145, Pc3, and LnCap cells.
Notes: Cells were transfected with (A) CpG-ODN (1 μM or 10 μM) for 24 hours or with (B) CpG-ODN (1 μM) for 6 or 24 hours. Cell viability was quantified by MTT colorimetric assay. The data are means ± SD of experiments performed in triplicate. Data shown are representative of three independent experiments.
Abbreviations: CpG-ODN, CpG oligodeoxynucleotides; MTT, 3-(4,5-dimethylthiazol-2-yl)-2,5-diphenyltetrazolium bromide; SD, standard deviation.
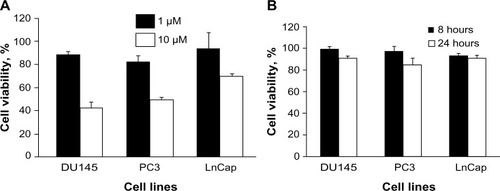
Figure 2 Dose-dependent effect of EGCG on cell viability on DU145, PC3, and LnCap cells.
Notes: Cells (A) DU145, (B) PC3, and (C) LnCap were treated with indicated concentration of EGCG for 24 hours. Cell viability was determined by MTT colorimetric assay. Data are shown as percent viability normalized to cells treated with vehicle (DMSO). The data shown are means ± SD of experiments performed in triplicate and are representative of three independent experiments.
Abbreviations: DMSO, dimethyl sulfoxide; EGCG, epigallocatechin-3-gallate; MTT, 3-(4,5-dimethylthiazol-2-yl)-2,5-diphenyltetrazolium bromide; SD, standard deviation.
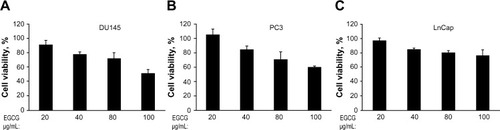
Figure 3 CpG-ODN stimulation induces the expression of proinflammatory cytokines and chemokines in prostate cancer cells.
Notes: DU145, PC3, and LnCap cells were transfected with CpG-ODN (1 μM) for 6 or 24 hours. Total RNA was prepared from each sample, converted to cDNA, and used for qRT-PCR in triplicate using the following gene-specific primers: (A) IL-6, (B) IL-8, (C) CXCL1, (D) IP-10, (E) CCL5, and (F) TGFβ1. RNA expression was normalized to GAPDH mRNA levels. The data shown are means ± SD of experiments performed in triplicate. Student’s t-test: *P<0.001; **P<0.05; #not significant.
Abbreviations: CpG-ODN, CpG oligodeoxynucleotides; qRT-PCR, quantitative reverse transcription polymerase chain reaction; SD, standard deviation; cDNA, complementary DNA; mRNA, messenger RNA; Gapdh, glyceraldehyde 3-phosphate dehydrogenase; IL, interleukin; CXCL1, chemokine (C-X-C motif) ligand 1; IP-10, interferon gamma-induced protein 10; TGFβ1, tumor growth factor beta 1; CCL5, chemokine (C-C motif) ligand 5.
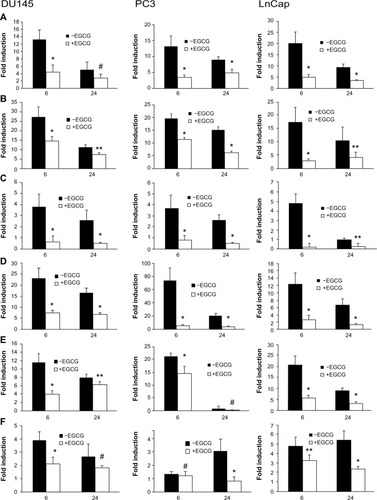
Figure 4 Effect of inhibition of NF-κB on CpG-ODN-induced expression of chemokines and cytokines.
Notes: DU145 and PC3 cells were pretreated or not (No Inh) with the NF-κB inhibitor, Bay11-7082 (10 μM) for 1 hour prior to transfection with CpG-ODN (1 μM) for 6 hours. Total RNA was prepared from each sample, converted to cDNA, and used for qRT-PCR in triplicate using the following gene-specific primers: IL-6, IL-8, CXCL1, IP-10, CCL5, and TGFβ1. RNA expression was normalized to GAPDH mRNA levels. The data shown are means ± SD of experiments performed in triplicate. Student’s t-test: *P<0.001; **P<0.05.
Abbreviations: NF-κB, nuclear factor kappa-light-chain-enhancer of activated B cells; CpG-ODN, CpG oligodeoxynucleotides; qRT-PCR, quantitative reverse transcription polymerase chain reaction; RLU, relative luciferase units; SD, standard deviation; IL, interleukin; CXCL1, chemokine (C-X-C motif) ligand 1; IP-10, interferon gamma-induced protein 10; TGFβ, tumor growth factor beta; cDNA, complementary DNA; GAPDH, glyceraldehyde 3-phosphate dehydrogenase; mRNA, messenger RNA; Inh, inhibitor.
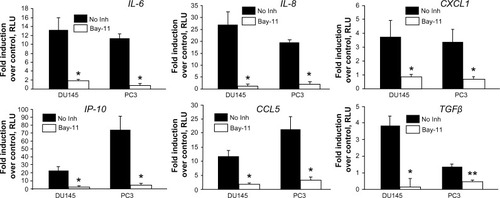
Figure 5 Induction of the IL-8 promoter by CpG-ODN requires NF-κB transcriptional activity.
Notes: (A) DU145 and (B) PC3 cells were cotransfected with 1.0 μg of IL-8 promoter fused to luciferase (IL-8 WT-luc) or constructs with mutations in NF-κB (IL-8mκB) or AP-1 binding sites (IL-8maP-1), along with 0.1 μg of Renilla luciferase plasmid. After 24 hours, cells were transfected with CpG-ODN (1 μM) with or without EGCG pretreatment (40 μg/ml) for 24 hours. IL-8-luciferase activity was normalized to Renilla luciferase activity and represented as fold induction. Data shown are means ± SD of experiments performed in triplicate. Student’s t-test: values as indicated.
Abbreviations: CpG-ODN, CpG oligodeoxynucleotides; EGCG, epigallocatechin-3-gallate; RLU, relative light units; SD, standard deviation; IL, interleukin; NF-κB, nuclear factor kappa-light-chain-enhancer of activated B cells; WT, wild-type.
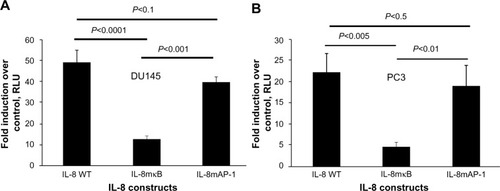
Figure 6 EGCG inhibits CpG-ODN-induced NF-κB transcriptional activation.
Notes: (A) DU145 and (B) PC3 cells were cotransfected with NF-κB-luciferase plasmid (1.0 μg) and Renilla luciferase plasmid (0.1 μg). After 24 hours, cells were transfected with CpG-ODN (1 μM) with or without EGCG pretreatment (40 μg/ml) for 24 hours. NF-κB luciferase activity was normalized to Renilla luciferase activity and represented as fold induction. Data shown are means ± SD of experiments performed in triplicate. Student’s t-test: values as indicated.
Abbreviations: CpG-ODN, CpG oligodeoxynucleotides; EGCG, epigallocatechin-3-gallate; RLU, relative luciferase units; SD, standard deviation; NF-κB, nuclear factor kappa-light-chain-enhancer of activated B cells.
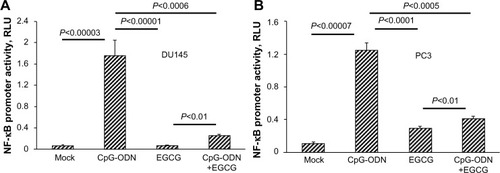
Figure 7 EGCG inhibits CpG-ODN-induced nuclear translocation of NF-κB.
Notes: DU145 cells were grown on glass cover slips and mock treated or transfected with CpG-ODN (1 μM) for 1 hour with or without EGCG pretreatment (40 μg/mL) for 24 hours. Cells were incubated with goat anti-rabbit polyclonal NF-κB p65 subunit antibody (green) for 1 hour followed by alexa Fluor 488 donkey anti-rabbit secondary antibody and mounted in VECTASHIELD® (Vector Labs, Burlingame, CA, USA) with DAPI to stain nuclei (blue). Images were merged to determine nuclear localization. Representative images of cells visualized under confocal microscope at 60× are shown.
Abbreviations: CpG-ODN, CpG oligodeoxynucleotides; DAPI, 4′,6-diamidino-2-phenylindole; EGCG, epigallocatechin-3-gallate; NF-κB, nuclear factor kappa-light-chain-enhancer of activated B cells; TNF, tumor necrosis factor.
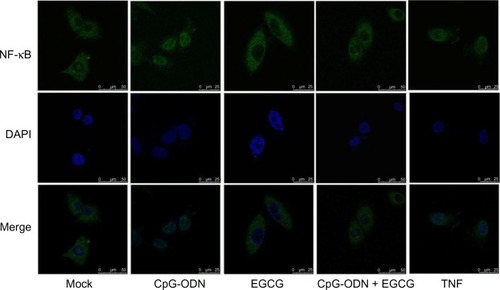
Figure 8 EGCG sequesters NF-κB p65 subunit in the cytosol.
Notes: DU145 cells were transfected with CpG-ODN (1 μM) for 1 hour with or without EGCG pretreatment (40 μg/ml) for 24 hours. Levels of NF-κB p65 subunit in the (A) nuclear extract normalized to histone H2A or (B) cytosol normalized to β-actin levels was determined by immunoblot analysis and compared to levels of inhibitory subunit IκBα.
Abbreviations: CpG-ODN, CpG oligodeoxynucleotides; EGCG, epigallocatechin-3-gallate; NF-κB, nuclear factor kappa-light-chain-enhancer of activated B cells.
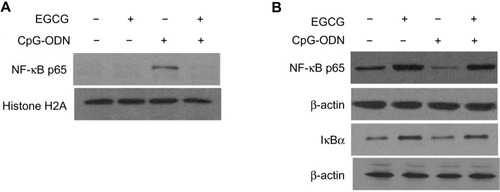
Figure 9 EGCG inhibits CpG-ODN-induced activity of MMP-9 and -2.
Notes: DU145, Pc3, and Lncap cells were transfected with CpG-ODN (1 μM) for 8 hours with or without EGCG pretreatment (40 μg/ml) for 24 hours. Activity of MMP-9 and -2 in culture supernatants was determined by electrophoresis in 8% SDS-Page gels containing 0.1% gelatin. Gels were stained and clear areas representing MMP activity were imaged. Results are representative of three independent experiments.
Abbreviations: CpG-ODN, CpG oligodeoxynucleotides; EGCG, epigallocatechin-3-gallate; MMP, matrix metalloproteinase; SDS-Page, sodium dodecyl sulfate polyacrylamide gel electrophoresis.
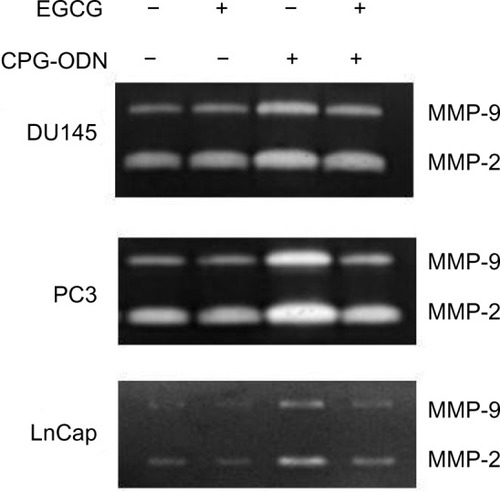
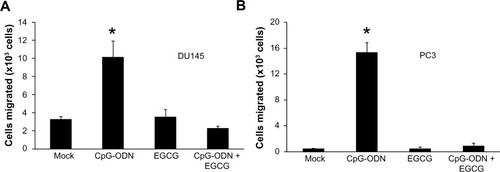
Figure 10 EGCG inhibits CpG-ODN-induced migration of DU145 and PC3 cells.
Notes: Cell migration assays were performed using a modified Boyden chamber containing fibronectin-coated polycarbonate membrane filter (8 μm pore size). DU145 or Pc3 cells (2×10⁵) were pretreated or not with EGCG (40 μg/ml) for 24 hours followed by transfection with CpG-ODN (1 μM). Cells were plated in the upper chamber and the lower chamber contained culture medium with 10% FBs. Cells were incubated for 24 hours at 37°C in 5% CO2. Nonmigrated cells were scraped from the upper surface of the membrane with a cotton swab, and migrated cells remaining on the bottom surface were trypsinized and counted with a hemocytometer. Data shown are means ± SD of experiments performed in triplicate. Student’s t-test: *P<0.001.
Abbreviations: CpG-ODN, CpG oligodeoxynucleotides; EGCG, epigallocatechin-3-gallate; FBS, fetal bovine serum; SD, standard deviation.