Figures & data
Table 1 Semiquantitative analysis of TZG-induced PGIS and CD45 immunoreactivity
Figure 1 PGI2 mediates the endothelial COX-2-dependent neuroprotective effect following excitotoxin injection.
Notes: (A) The percent of PGI2 stable metabolite (6-keto prostaglandin f1α) 12 hours after TZG injection in COX-2flox/flox and Tie2Cre COX-2flox/flox mice relative to saline controls. (B) Twenty-four-hour assessment of TZG induced lesion volume with or without the pretreatment of the PGIS inhibitor tranylcypromine in COX-2flox/flox mice and Tie2Cre COX-2flox/flox mice. (C) Twenty-four-hour assessment of TZG-induced lesion volume in COX-2flox/flox mice with or without treatment of the PGI2 stable analogue MRE-269 and/or low-dose NS-398. (D) Twenty-four-hour assessment of lesion volume in TZG injected COX-2flox/flox and Tie2Cre COX-2flox/flox mice following 1 or 4 hours pretreatment with MRE-269. Bars represent group means ± SEM. Means with different letters (a–c) are significantly different from one another in (C) (P<0.05 for all). *Represents a significant effect of TZG (A), tranylcypromine (B), and MRE-269 (D) compared to their respective control groups (P≤0.05 for all). N=5 in all experimental groups.
Abbreviations: +, positive; −, negative; PGI2, prostacyclin; PGIS, prostacyclin synthase; SEM, standard error; TZG, (RS)-(tetrazol-5-yl)glycine.
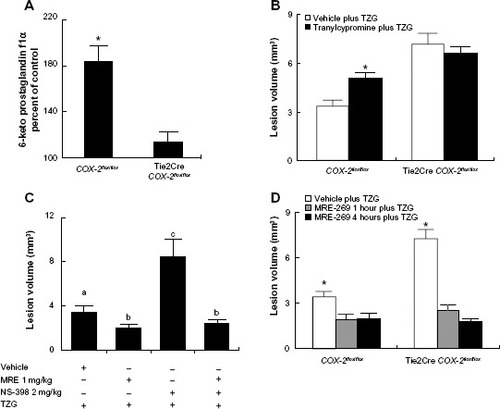
Figure 2 Presence of PGIS and CD45 IHC-positive cells following TZG injection.
Notes: (A) PGIS+ cells 12 hours after saline injection in COX-2flox/flox mice. (B) PGIS+ cells 12 hours after TZG injection into COX-2flox/flox mice. (C) PGIS+ cells 12 hours after TZG injection into Tie2Cre COX-2flox/flox mice. (D) PGIS+ cells 12 hours after TZG and NS-398 (2 mg/kg) injection into COX-2flox/flox mice. (E) CD45+ cells 12 hours after saline injection in COX-2flox/flox mice. (F) CD45+ cells 12 hours after TZG injection into COX-2flox/flox mice. (G) CD45+ cells 12 hours after TZG injection into Tie2Cre COX-2flox/flox mice. (H) CD45+ cells 12 hours after TZG and NS-398 (2 mg/kg) injection into COX-2flox/flox mice. Representative distribution of (I) PGIS+ and (J) CD45+ cells. Time course of appearance of PGIS expressing cells, 4 (K), 8 (L), 12 (M), and 24 (N) hours after TZG injection in COX-2flox/flox mice. Scale bar: 150 μm.
Abbreviations: PGIS, prostacyclin synthase; TZG, (RS)-(tetrazol-5-yl)glycine; IHC, immunohistochemistry.
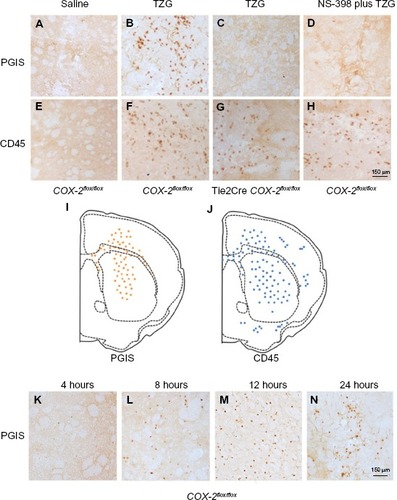
Figure 3 Identification of PGIS expressing cell types in the lesion core.
Notes: PGIS-labeled cells (A, D and G) double labeled with CD45 (B), F4/80 (E), and Ly6G (H). Merged pictographs for PGIS/CD45 (C), PGIS/F4/80 (F), and PGIS/Ly6G (I) double-positive cells. Scale bars: 25 μm (A–I). Representative flow cytometric dot plots of Ly6G-positive/Gr1-positive blood neutrophils (J) from TZG-injected mice following in vivo administration of either neutrophil depleting antibody 1A8 or PBS. Ly6G (K and L) and PGIS (M and N) expressing cells in brains of TZG treated mice following PBS (K and M) or 1A8 (L and N) treatment. All IHC and flow cytometric assessments were made 12 hours following TZG injections. Scale bars: 150 μm.
Abbreviations: IHC, immunohistochemistry; PBS, phosphate buffered saline; PGIS, prostacyclin synthase; TZG, (RS)-(tetrazol-5-yl)glycine.
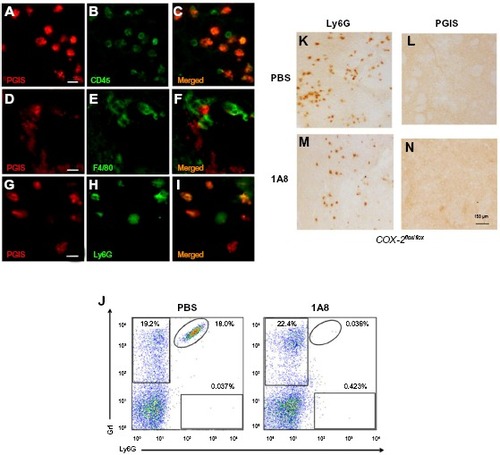
Figure 4 PGI2 attenuates TZG-induced calcium influx into neurons.
Notes: (A) A representative neurons’ calcium influx induced by ex vivo TZG (blue line) or TZG plus MRE-269 treatment (red line). (B) Neuronal calcium influx induced by ex vivo TZG or ACSF pretreatment before TZG administration (red line). Maximum calcium labeling (amplitude) (C) and area under curve (D) of calcium influx in individual cells after MRE-269 plus TZG and TZG treatment alone. Bars represent group means ± SEM. *Represents a significant effect of MRE-269 plus TZG compared to TZG treatment alone (P≤0.01 for both). N=10 in one slice preparation.
Abbreviations: ACSF, artificial cerebral-spinal fluid; PGI2, prostacyclin; SEM, standard error; TZG, (RS)-(tetrazol-5-yl)glycine.
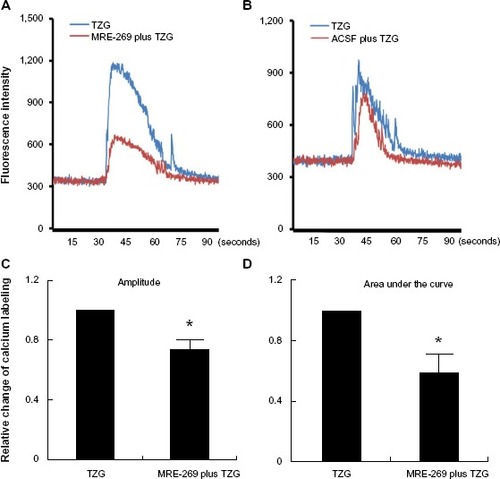
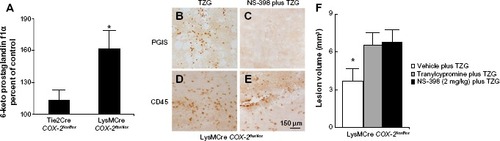
Figure 5 Deletion of the COX-2 gene in myeloid cells does not prevent endogenous PGI2 dependent protection from TZG-induced neurotoxicity.
Notes: (A) The level of 6-keto prostaglandin f1α in LysMCre COX-2flox/flox mice compared with Tie2Cre COX-2flox/flox mice 12 hours after TZG injection. (B and C) PGIS- and (D and E) CD45-labeled cells in the injured striatum in LysMCre COX-2flox/flox mice 12 hours after TZG alone or NS-398 plus TZG treatment; scale bar: 150 μm. (F) Twenty-four-hour assessment of TZG-induced lesion volume in pretreated tranylcypromine, NS-398, or TZG alone animals. Bars represent group means ± SEM. *Represents a significant effect compared to all other groups (P≤0.01 for all). N=5 in all experimental groups.
Abbreviations: PGI2, prostacyclin; PGIS, prostacyclin synthase; SEM, standard error; TZG, (RS)-(tetrazol-5-yl)glycine.