Figures & data
Figure 1 Concentration-dependent release of CXCL8.
Notes: CXCL8 after exposure to (A) NaF and (B) TPA.Aa549 cells were exposed to NaF (0–5 mM) and TPA (0–100 nM) for 20 hours, and assessed for the release of CXCL8 by ELISA. The data represent the mean ± SEM of three independent experiments. *Significant increase of CXCL8 release; P≤0.05. One-way ANOVA with Dunnett’s multiple comparisons test. The statistics were performed on log-transformed data.
Abbreviations: CXCL8, interleukin-8; NaF, sodium fluoride; TPA, 12-O-tetradecanoylphorbol-13-acetate; ELISA, enzyme-linked immunosorbent assay; SEM, standard error of the mean; ANOVA, analysis of variance.
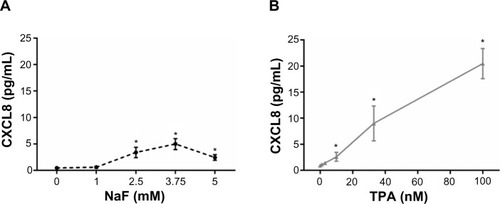
Figure 2 Time-dependent increase in CXCL8 mRNA expression in A549 cells upon exposure to NaF and TPA.
Notes: A549 cells were exposed to 3.75 mM of NaF and 100 nM of TPA for up to 10 hours, and assessed for CXCL8 mRNA by real-time PCR. The data represent the mean ± SEM of four independent experiments. *Significant increase (P<0.05) in CXCL8 mRNA. #Significantly different (P<0.05) from the CXCL8 increase in TPA-treated cells. Two-way ANOVA with Šidák’s multiple comparisons test. The statistics were performed on log-transformed data.
Abbreviations: CXCL8, interleukin-8; NaF, sodium fluoride; TPA, 12-O-tetradecanoylphorbol-13-acetate; mRNA, messenger RNA; PCR, polymerase chain reaction; SEM, standard error of the mean; ANOVA, analysis of variance.
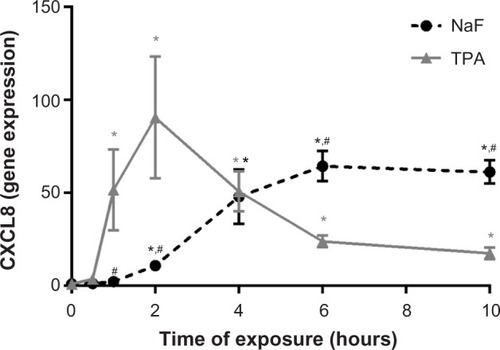
Figure 3 Effect of short-term exposure on NaF- and TPA-induced CXCL8 responses.
Notes: (A) NaF- and (B) TPA-induced CXCL8 responses. A549 cells were exposed to 3.75 mM of NaF or 100 nM of TPA for 0.5 hour, 1 hour, 3 hours, 4 hours, 6 hours, 8 hours, 10 hours, and 20 hours. The culture medium was replaced with medium without NaF/TPA at the respective time points, and further cultured up to 20 hours. The CXCL8 releases were measured by ELISA 20 hours after exposure start. The data represent the mean ± SEM of three independent experiments. *Significantly different from no media shift, P<0.05 (one-way ANOVA with Dunnetts multiple comparison test).
Abbreviations: NaF, sodium fluoride; CXCL8, interleukin-8; TPA, 12-O-tetradecanoylphorbol-13-acetate; ELISA, enzyme-linked immunosorbent assay; SEM, standard error of the mean; ANOVA, analysis of variance.
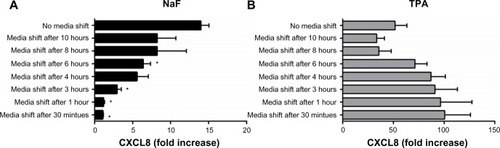
Figure 4 Time-dependent changes of MAPK ERK1/2, p38, and JNK1/2 phosphorylation upon NaF and TPA exposure.
Notes: (A) MAPK ERK1/2, (B) p38, and (C) JNK1/2. a549 cells were exposed to (Aa, Ba, and Ca) NaF (3.75 mM) and (Ab, Bb, and Cb) TPA (100 nM) for the time periods indicated. The MAPK phosphorylations were assessed by Western analysis. The phosphorylated ERK1/2 was related to β-actin. Phosphorylated p38 was related to total p38, whereas phosphorylated JnK1/2 was related to β-actin. A typical experiment is shown by Western blot and subsequent optical quantification. Values are expressed in percentage of the maximal phosphorylation observed. The experiment is representative of 3–5 experiments.
Abbreviations: NaF, sodium fluoride; ERK, extracellular signal-regulated kinase; TPA, 12-O-tetradecanoylphorbol-13-acetate; max, maximum; JNK, c-jun-N-terminal kinase; MAPK, mitogen-activated protein kinase.
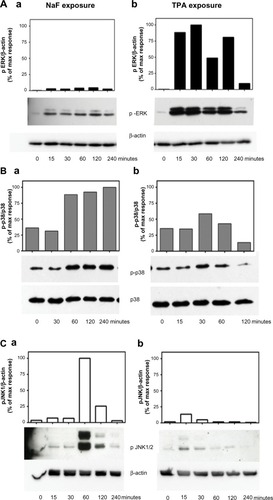
Table 1 The relative effect of MAPK inhibitors on NaF- and TPA-induced CXCL8 release
Figure 5 Involvement of MAPKs in TPA-induced CXCL8 release.
Notes: (A) A549 cells were pretreated for 1 hour with the p38 inhibitor SB202190 (10 μM), the ERK1/2 inhibitor PD98059 (25 μM), and the JNK1/2-inhibitor SP600125 (20 μM) prior to exposure with 100 nM of TPA for 20 hours, and assessed for CXCL8 release by ELISA. (B) The cells were transfected with siRNA against JNK2 and nonspecific siRNA for 48 hours, exposed for 100 nM of TPA for 20 hours, and assessed for CXCL8 release. The values are presented in percentage of the TPA response, and represent the mean ± SEM of three independent experiments. *Significant reduction as analyzed by multiple t-tests (P≤0.05). (C) JNK1/2 levels after exposure to siRNA against JNK2 as shown by a typical Western blot. The JNK1/2 levels were related to β-actin.
Abbreviations: CXCL8, interleukin-8; TPA, 12-O-tetradecanoylphorbol-13-acetate; siRNA, small interfering RNA; JNK, c-jun-N-terminal kinase; MAPKs, mitogen-activated protein kinases; ERK, extracellular signal-regulated kinase; ELISA, enzyme-linked immunosorbent assay; SEM, standard error of the mean.
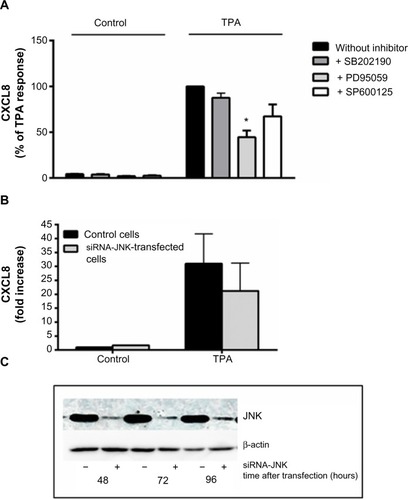
Figure 6 Time-dependent changes of NaF- and TPA-induced IκBα degradation, p65 phosphorylation, and p65 translocation.
Notes: (A) NaF- and TPA-induced IκBα degradation; (B) p65 phosphorylation; and (C) p65 translocation. A549 cells were exposed to 3.75 mM of NaF (Aa, Ba, Ca) and to 100 nM of TPA (Ab, Bb, Cb) for the time periods indicated. The IκBα, β-actin, p65, and p-p65 levels were measured in cell lysates, and translocated p65 in nuclei. The data are shown by typical Western blots (out of 3–5 separate experiments) and by optical quantification of the protein bands. (A) IκBα levels were related to β-actin; (B) p65 phosphorylation levels in lysates were related to p65; and (C) the p65 levels in the nuclei were related to histon H1 (a stable marker in nuclei). The levels of the cytosolic marker (GAPDH) in the nuclear samples are also shown. The blot is typical for three experiments.
Abbreviations: NaF, sodium fluoride; TPA, 12-O-tetradecanoylphorbol-13-acetate; max, maximum; GAPDH, glyceraldehyde 3-phosphate dehydrogenase.
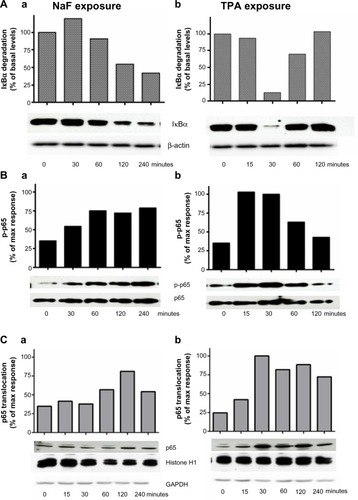
Figure 7 Effect of curcumin on NaF- and TPA-induced changes in NF-κB in A549 cells.
Notes: (A) Effects of curcumin (50 μM, 75 μM, and 100 μM) on IκBα degradation in lysates; (B) p65 phosphorylation in lysates; and (C) p65 translocation to nuclei. The cells were pretreated with curcumin at the indicated concentrations for 1 hour, and further exposed to NaF (3.75 mM) (Aa, Ba, and Ca) and TPA (100 nM) (Ab, Bb, and Cb) for 2 hours and 30 minutes, respectively. IκBα levels in lysates were related to β-actin, phosphorylation of p65 in lysates was related to total p65, and translocation of p65 was related to histon in the nuclei. The data are shown by typical Western blots, and also presented by optical quantification of the blots, given in relation to the responses (100%) to NaF and TPA at 2 hours and 30 minutes. The experiments in (A) and (C) are typical for four experiments and in (B) for two experiments.
Abbreviations: NaF, sodium fluoride; TPA, 12-O-tetradecanoylphorbol-13-acetate; max, maximum; NF-κB, nuclear factor kappa B.
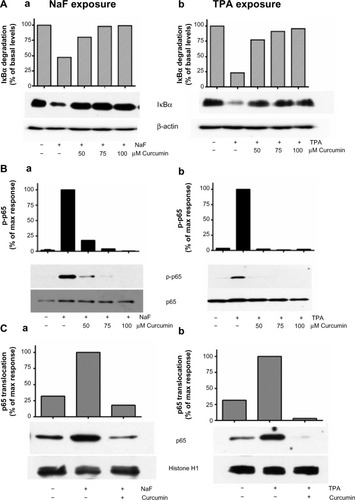
Figure 8 Concentration–response relationships for different NF-κB inhibitors versus fluoride- and TPA-induced CXCL8 release.
Notes: A549 cells were pretreated with different NF-κB inhibitors for 1 hour, and then further exposed to 3.75 mM of NaF (Aa, Ba, Ca, and Da) and 100 nM of TPA (Ab, Bb, Cb, and Db) for 20 hours. (A) BAYII-7082 (2.5–10 μM); (B) MG132 (2.5–10 μM); (C) PDTC (25–75 μM); and (D) curcumin (50–100 μM). The CXCL8 released to the medium was measured by ELISA. The data represent the mean ± SEM from 3–4 experiments.
Abbreviations: NaF, sodium fluoride; CXCL8, interleukin-8; TPA, 12-O-tetradecanoylphorbol-13-acetate; PDTC, pyrrolidine dithiocarbamate; NF-κB, nuclear factor kappa B; ELISA, enzyme-linked immunosorbent assay; SEM, standard error of the mean.
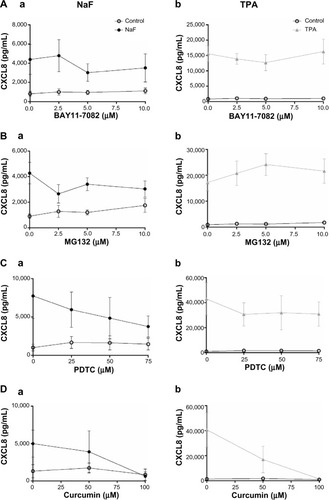
Figure 9 Effects of siRNA against p65 on NaF- and TPA-induced CXCL8 release.
Notes: (A) A549 cells were pretreated for 24 hours with siRNA against p65 (si p65), and then further exposed to NaF (3.75 mM) and TPA (100 nM) for 20 hours. The cells were also transfected with nonsense siRNA, si NT. The CXCL8 released to the medium was measured by ELISA. (B) The p65 levels are presented after exposure with siRNA against p65 (si p65) and a negative control (si NT). The p65 levels are related to β-actin levels. The data represent the mean ± SEM from 3–4 experiments. *Significant reduction as analyzed by student’s t-test (P≤0.05). The statistics were performed on log-transformed data.
Abbreviations: CXCL8, interleukin-8; siRNA, small interfering RNA; NaF, sodium fluoride; TPA, 12-O-tetradecanoylphorbol-13-acetate; ELISA, enzyme-linked immunosorbent assay; SEM, standard error of the mean; si p65; small interference RNA against p65; si NT; non-targeting small interference RNA.
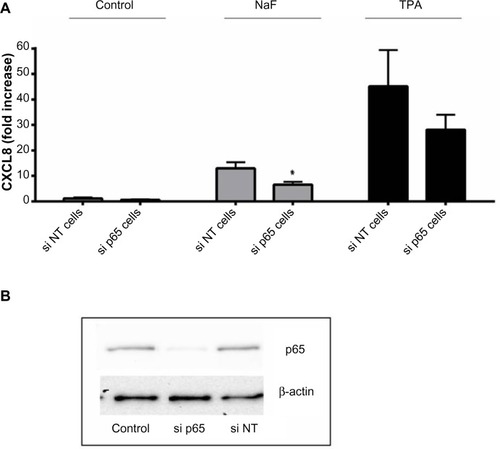
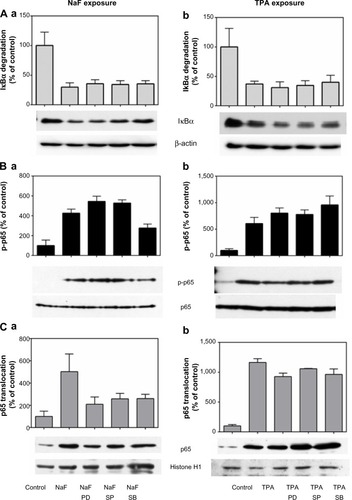
Figure 10 Relationship between MAPK and NF-κB activity after fluoride and TPA exposure.
Notes: Effect of MAPK inhibitors on (A) IκBα degradation, (B) p65 phosphorylation, and (C) p65 translocation. A549 cells were pretreated for 1 hour with the p38 inhibitor SB202190 (10 μM), the ERK1/2 inhibitor PD98059 (25 μM), and the JNK1/2 inhibitor SP202190 (20 μM) prior to 2 hours of exposure with 3.75 mM of NaF (Aa, Ba, and Ca) or 30 minutes of exposure with 100 nM of TPA (Ab, Bb, and Cb). Typical blots are shown, and quantification data representing the mean ± SEM of 3–6 independent experiments. The data are presented in percentages of the control values. The IκBα levels in lysates were related to β-actin, p65 phosphorylation in lysates was related to total p65, and p65 in nuclei was related to histon H1.
Abbreviations: NaF, sodium fluoride; TPA, 12-O-tetradecanoylphorbol-13-acetate; PD, PD98059; SB, SB202190; SP, sP6001254; MAPK, mitogen-activated protein kinase; NF-κB, nuclear factor kappa B; ERK, extracellular signal-regulated kinase; JNK, c-jun-N-terminal kinase; SEM, standard error of the mean.