Figures & data
Figure 1 Expression of high-mobility group box 1 mRNA in peripheral blood mononuclear cells by real-time polymerase chain reaction analysis.
Notes: Total RNA was obtained from peripheral blood mononuclear cells of the control group and from acute obstructive suppurative cholangitis-induced sepsis patients (before the drainage, 12 hours after the drainage, and 24 hours after the drainage, respectively). Electrophoresis of high-mobility group box 1 gene fragment amplification product is shown. Lane 1 represents polymerase chain reaction product of control group, lane 2 represents polymerase chain reaction product of AOSC-induced sepsis group 24 hours after the drainage, lane 3 represents polymerase chain reaction product of AOSC-induced sepsis group 12 hours after the drainage, lane 4 represents polymerase chain reaction product of AOSC-induced sepsis group before the drainage and lane 5 represents DL2000 marker.
Abbreviations: AOSC, acute obstructive suppurative cholangitis; HMGB1, high-mobility group box 1.
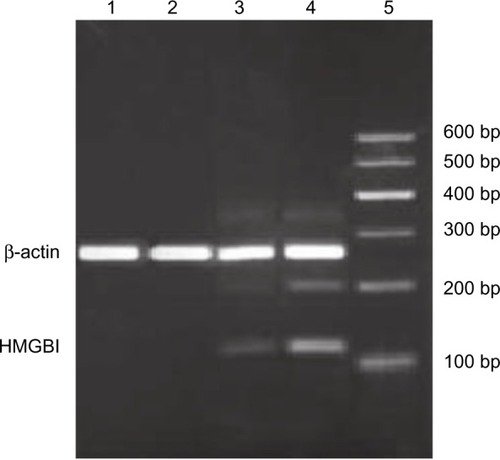
Figure 2 Western blotting analysis of high-mobility group box 1 protein expression in peripheral blood mononuclear cells.
Notes: Western blotting was performed to detect protein level of high-mobility group box 1. Total protein was extracted from peripheral blood mononuclear cells. Lane 1 represents the control, lane 2 represents preoperation, lane 3 represents postoperation 12 hours, and lane 4 represents postoperation 24 hours.
Abbreviation: HMGB1, high-mobility group box 1.
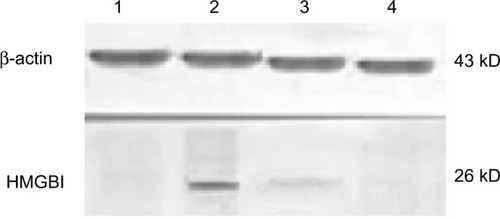
Figure 3 Comparison of high-mobility group box 1 (HMGB1) mRNA and high-mobility group box 1 protein expression among patients with acute obstructive suppurative cholangitis and controls (n=23).
Notes: ⋆compared with control, P<0.01; •compared with predrainage, P<0.01.
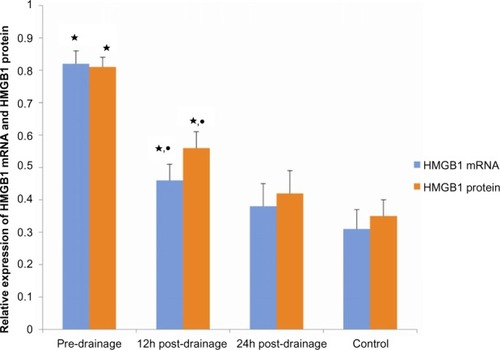
Figure 4 The analysis of tumor necrosis factor alpha by enzyme-linked immunosorbent assay (ELISA) in serum of operated and healthy controls.
Notes: Tumor necrosis factor alpha (TNF-α) was quantitated using an ELISA kit. Data are expressed as median for each sample. Experiments were performed at least three times, getting similar results. ⋆compared with control, P<0.01; •compared with 12 hours postdrainage, P<0.01.
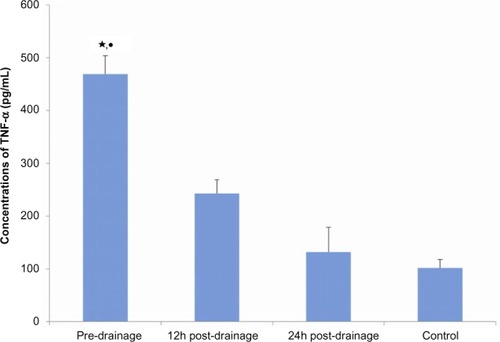
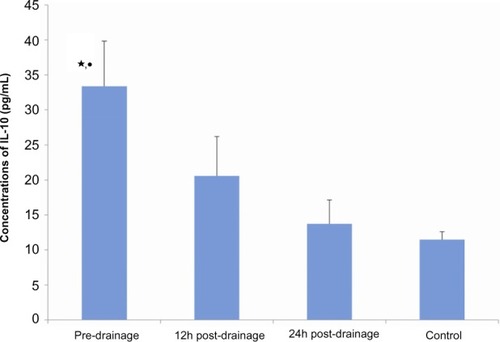
Figure 5 The analysis of interleukin 10 (IL-10) by enzyme-linked immunosorbent assay (ELISA) in serum of operated and healthy controls.
Notes: Tumor necrosis factor alpha was quantitated using ELISA kit. Data are expressed as median for each sample. Experiments were performed at least three times getting similar results. ⋆compared with control, P<0.01; •compared with 12 hours postdrainage, P<0.01.