Figures & data
Figure 1 IFNγ upregulates IDO in primary human saphenous vein endothelial cells (HSVECs).
Notes: cells were treated with IFNγ (80 ng/mL) for 2 days. IDO expression levels were assessed using immunoblotting, and IDO activity was assessed using the L-kynurenine IDO activity assay. Results show that IDO protein levels (A) and IDO activity (B) are increased after HSVECs are stimulated with IFNγ for 2 days. Immunoblotting data (A) are presented as a representative blot of three experiments and kynurenine activity assay (B) is presented as means + standard error of the mean (n=4). *P<0.05.
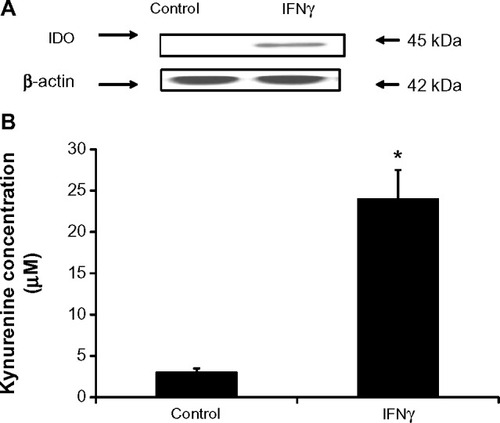
Figure 2 IFNγ is the main regulator of IDO in human saphenous vein endothelial cells (HSVECs).
Notes: Cells were treated with IFNγ (80 ng/mL), TNFα (80 ng/mL), ILIβ (20 ng/mL), IL2 (20 ng/mL), IL4 (40 ng/mL), IL6 (40 ng/mL), IL10 (40 ng/mL), and TGFβ (100 ng/mL) either alone or in combination for 2 days. IDO expression was determined using real-time quantitative polymerase chain reaction. Results show that only IFNγ significantly increases expression of IDO in HSVECs (A). Co-treatment of cells with IFNγ and the other cytokines did not result in changes in IFNγ-driven increases in IDO expression (B). Results are presented as the means of three experiments + standard error of the mean. *P<0.05.
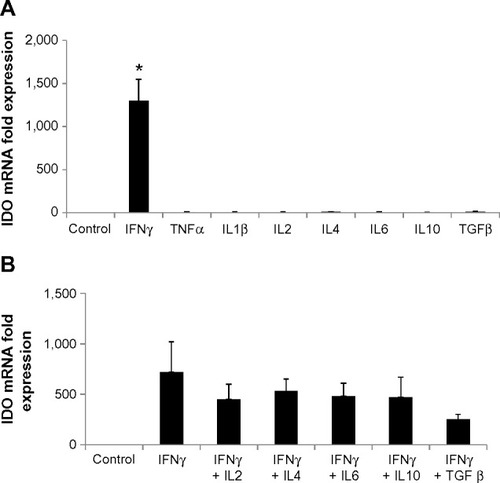
Figure 3 Negative regulators of IDO expression in primary human saphenous vein endothelial cells (HSVECs).
Notes: Cells were treated with IFNγ (80 ng/mL) either alone or in combination with VEGFβ (40 ng/mL), heparin (10 mg/mL and 20 mg/mL), or nitric oxide donor DetaNO (10 μM and 50 μM). Expression of IDO and SOCS3 was determined using immunoblotting. Results show that IDO expression is reduced in cells treated with IFNγ and VEGFβ relative to cells treated with IFNγ only. Protein levels of SOCS3 also decreased after 48 hours of treatment of HSVECs with IFNγ and VEGFβ relative to cells treated with IFNγ only (A). Co-treatment of HSVECs with IFNγ and heparin also resulted in a reduction of IFNγ-driven increase in IDO activity (B). Co-treatment of HSVECs with IFNγ and DetaNO resulted in reduction of IFNγ-driven increases in IDO activity (C) but not in IDO expression levels (D). Immunoblotting data are presented as representative blots that were repeated at least three times. IDO activity results are presented as means + standard error of the mean of three independent experiments. *P<0.05.
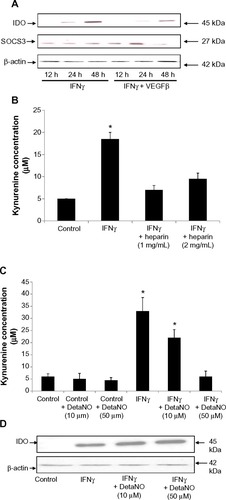
Figure 4 IDO does not affect T-cell transmigration properties.
Notes: Human saphenous vein endothelial cells (HSVECs) were transfected with pcDNA3.1-EGFP and signal was detected up to 6 days after transfection. HSVECs were then transiently transfected with pSMART2G-IDO. Transfected cells were plated in Transwell chambers and left to incubate for 1 day. T-cells were then added and incubation was continued for a further day. T-cells transmigrated through the endothelial monolayer were then counted using a hemocytometer. Results show that IDO does not affect the number of T-cells transmigrating through the endothelial cell barrier. Results are presented as an average of one experiment that was repeated three times with similar results.
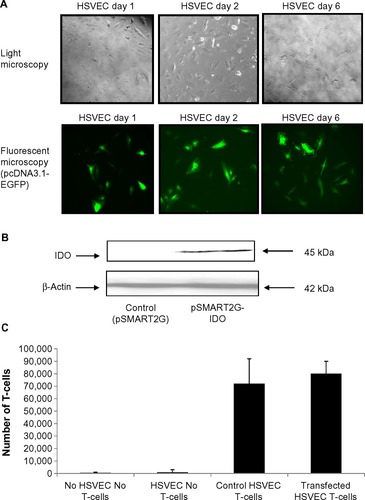
Figure S1 IDO dose–response curve.
Note: Results are presented as means + standard deviation of one experiment.
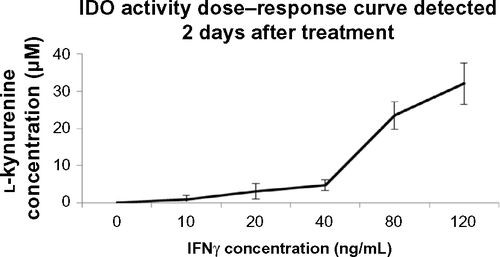
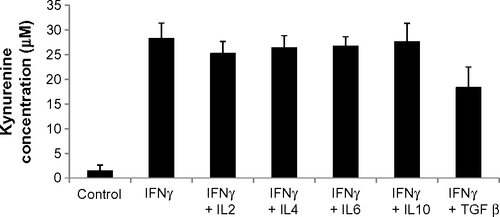
Figure S2 IDO activity after treatment of human saphenous vein endothelial cells with cytokines for 2 days.
Note: Results are presented as means + standard deviation of one experiment.