Figures & data
Table 1 gene-specific primers used for qRT-PcR
Table 2 sequenom™ primers used for MT1-MMP promoter methylation analysis
Figure 1 MT1-MMP mRNA and protein expression in villous explants.
Notes: (A) qRT-PcR was used to detect MT1-MMP mRNA expression in tissues treated with/without 5 μg/mL LPS with/without prior 5 μM AZA treatment. MT1-MMP mRNA was significantly increased in explants pre-treated with AZA and then cultured with LPS for 24 hours and 48 hours. LPS treatment alone increased MT1-MMP mRNA in explants after 48 hours. (B) Western blotting was used to detect MT1-MMP protein in tissues treated with/without 5 μg/mL LPS with/without prior 5 μM AZA treatment. MT1-MMP protein was significantly increased in placental explants pre-treated with AZA and then stimulated with LPS for 24 hours and 48 hours and in MT1-MMP protein treated with LPS alone for 24 hours. In (A), data are presented as mean fold change in MT1-MMP transcript normalized to RPLPO and RPL13a compared to time-matched controls (±SEM; n=8 in each group), *P<0.05. In (B), data are presented as mean fold change in MT1-MMP protein normalized to β-actin optical density, compared to time-matched controls (±SEM; n=8 in each group); *P<0.05.
Abbreviations: qRT-PcR, quantitative real-time polymerase chain reaction; MT1-MMP, membrane type 1 matrix metalloproteinase; LPS, lipopolysaccharide; AZA, 5-aza-2′-deoxycytidine; RPLPO, large ribosomal protein; RPL13, ribosomal protein type 13; SEM, standard error of the mean; h, hours; n, number in each group.
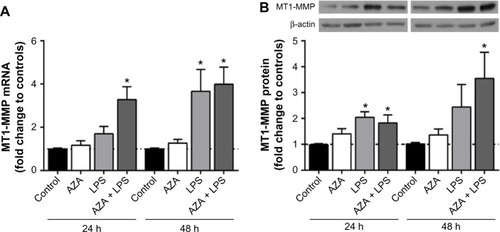
Figure 2 Secreted MMP2 activity from villous explants.
Notes: Gelatin zymography was used to assess MMP2 activity in conditioned media from tissue explants treated with/without 5 μg/mL LPS with/without prior 5 μM AZA treatment. Pro-MMP2 activity is shown by white bars; activated MMP2 activity is shown by gray bars. a representative zymogram is shown above the graph. levels of the secreted MMPs were normalized with respect to the total protein content and expressed as a percentage of time-matched controls (mean ± SEM; n=8 in each group); *P<0.05.
Abbreviations: MMPs, matrix metalloproteinases; MMP2, MMP type 2; pro-MMP2, latent MMP2; LPS, lipopolysaccharide; AZA, 5-aza-2′-deoxycytidine; SEM, standard error of the mean; h, hours; n, number in each group.
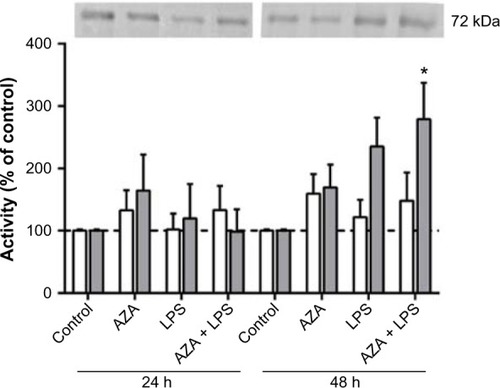
Figure 3 Secreted TIMP2 protein from villous explants.
Notes: ELISA was used to assess TIMP2 protein in conditioned media from tissue explants treated with/without 5 μg/mL LPS with/without prior 5 μM AZA treatment. levels of secreted TIMP2 were normalized with respect to the total protein content (mean ± SEM; n=8 in each group); *P<0.05.
Abbreviations: TIMP2, tissue inhibitor of metalloproteinase type 2; ELISA, enzyme-linked immunosorbent assay; LPS, lipopolysaccharide; AZA, 5-aza-2′-deoxycytidine; SEM, standard error of the mean; h, hours; n, number in each group.
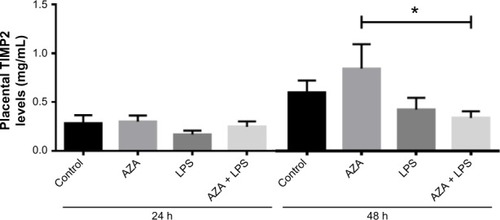
Figure 4 MT1-MMP promoter methylation in villous explants.
Notes: Sequenom™ EpiTyper® MassaRRaY was used to measure methylated cytosine residues (5-mC) within the MT1-MMP promoter in tissues treated with 5 μg/mL LPS with/without prior 5 μM AZA treatment. % of 5-Methylcytosine (%5-mC) was calculated from the ratio of mass signals between methylated and nonmethylated DNA in each sample. Data are presented as mean %5-mC across all CpGs ± SEM (n=8).
Abbreviations: MT1-MMP, membrane type 1 matrix metalloproteinase; LPS, lipopolysaccharide; AZA, 5-aza-2′-deoxycytidine; SEM, standard error of the mean; h, hours; n, number in each group.
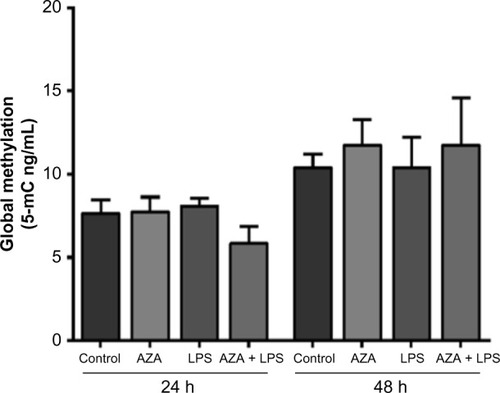
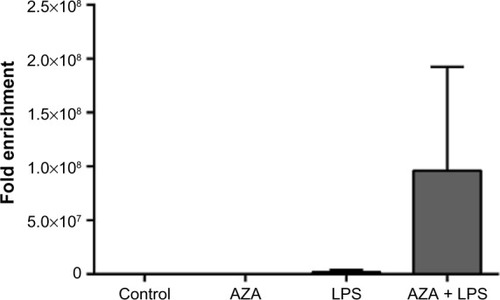
Figure 5 Chromatin accessibility assay of treated villous explants.
Notes: Chromatin structures of treated villous explants were determined by specific nucleases. DNA in heterochromatin was inaccessible to the nucleases, resulting in insignificant ct shifts between digested and undigested samples, whereas DNA in euchromatin was accessible to nucleases, resulting in a large ct shift shown as fold enrichment. Treatment with combined AZA and LPS resulted in large fold enrichment, signifying the DNA is more open than in the control, AZA alone, or LPS alone treatments. Data are presented as the ratio of amplification efficiency of the Nse-treated DNA sample over that of the No-Nse (control) sample (mean fold enrichment) ± SEM (n=2).
Abbreviations: LPS, lipopolysaccharide; AZA, 5-aza-2′-deoxycytidine; Nse, nuclease; SEM, standard error of the mean; n, number in each group; No-Nse, control samples not treated with nuclease.